Susan Schwartz (UC Santa Cruz), Anne Sheehan (University Colorado, Boulder), Rachel Abercrombie (Boston University)
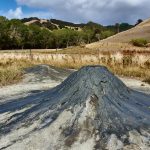
In the last fifteen years, it has become evident that slow slip events (SSEs) are a common and important part of the subduction process. They produce millimeters to centimeters of surface displacement over days to years that can be measured by geodesy and are often accompanied by seismic tremor and earthquake swarms. Slow slip and tremor have been observed in subduction zones in Cascadia, Japan, Mexico, Alaska, Ecuador, northern Peru, Costa Rica and New Zealand.
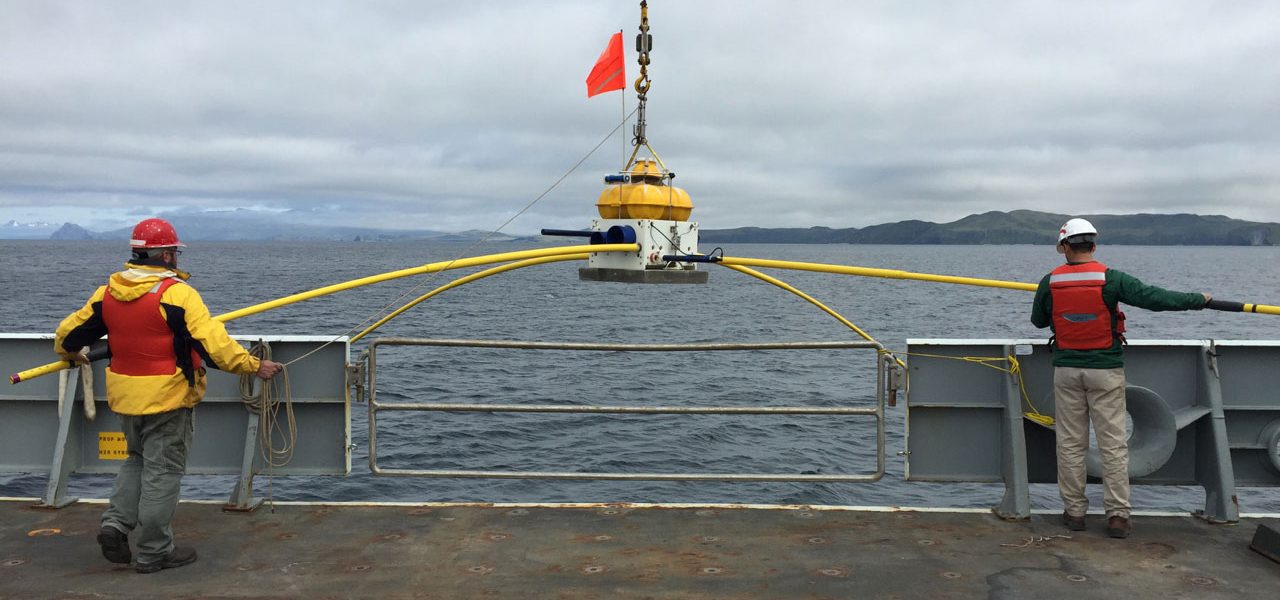
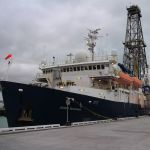
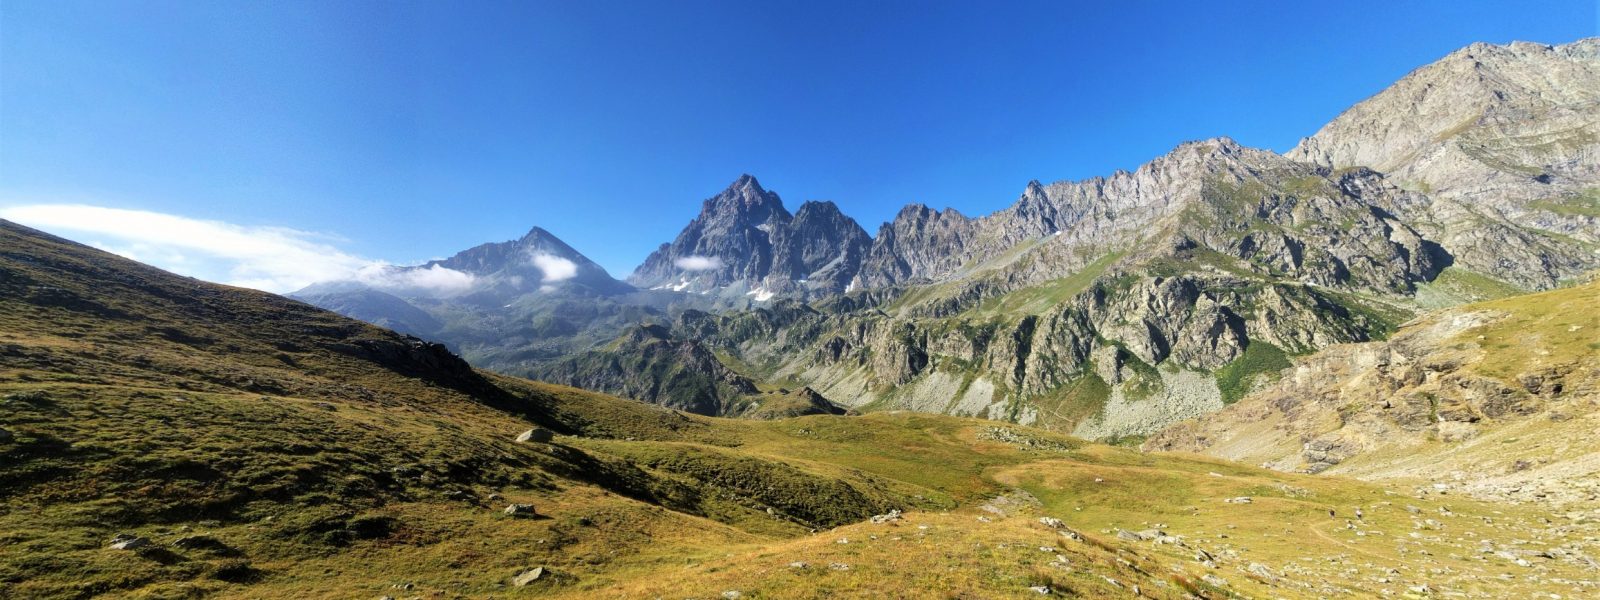
The 2014-15 HOBITSS deployment of 24 ocean bottom pressure sensors and fifteen ocean bottom seismometers (OBSs) at the northern Hikurangi margin, New Zealand captured a M7.0 SSE. The vertical deformation data collected were used to image one of the best-resolved slow slip distributions to date, and indicated slip very close, if not all the way to the trench (Wallace et al., 2016). The Fall 2016 GeoPRISMS Newsletter reported on this experiment and how for the first time, ocean bottom pressure recorders successfully mapped a SSE displacement field (Wallace et al., 2016). The HOBITSS results were instrumental in demonstrating that Absolute Pressure Gauges are a valuable tool for seafloor geodesy. Seismologists from UC Santa Cruz, University of Colorado Boulder and Boston University are now using the seismic data collected during the same experiment to evaluate the spatiotemporal relationship between seismicity (both earthquakes and tremor) and the slow slip event and the role that seismic structure plays in controlling slip behavior. One of our primary goals is to determine if slow and fast interplate slip modes spatially overlap or are segregated.
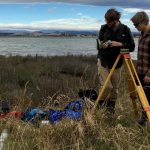
An initial catalog of local earthquakes was constructed and relocated in a New Zealand-derived velocity model to produce a catalog of 2,619 earthquakes ranging in magnitude between 0.5 and 4.7. Locations indicate that Hikurangi seismicity is concentrated in two NE-SW bands, one offshore beneath the Hikurangi trough and outer forearc wedge, and one onshore beneath the eastern Raukumara Peninsula, with a gap in seismicity between the two beneath the inner forearc wedge. We do not find an increase in seismicity during the 2014 slow slip event, though seismicity is slightly higher in the month following the SSE. The majority of earthquakes are within the subducting slab rather than at the plate interface. The few events that locate close to the plate interface were assumed to be thrust events and used as templates in a waveform matching technique to identify similarly located earthquake swarms within the entire dataset.
Like the general seismicity increase in the month following the SSE, repeating families of interplate events (Fig. 1) also cluster in time at the end of the SSE. They are spatially concentrated within the slow slip patch and associated with a well-imaged subducted seamount (Bell et al., 2010).
Tectonic tremor was also identified toward the end and continuing after the slow slip event. Like the interplate earthquake families, tremor is also co-located with slow slip and localized in the vicinity of subducted seamounts (Fig. 2). The subsequent, rather than synchronous occurrence of tremor and interplate earthquakes and slow slip suggests that seamount subduction plays the dominant role in the stress state of the shallow megathrust. While northern Hikurangi seamounts appear to primarily subduct aseismically, their subduction may generate elevated pore-fluid pressures in accumulated underplated sediment packages and a complex, interconnected fracture network such that tremor and microseismicity occur as seismic components of seamount subduction during shallow slow slip. This study indicates that the location of subducted seamounts is strongly correlated with the distribution of SSE-associated tectonic tremor and repeating earthquakes. The seamounts appear to be responsible for slow slip, tremor, and microseismicity rupturing adjacent regions in a range of slip processes.
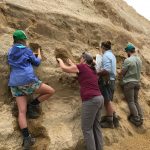
Ongoing work more fully utilizes the rich data set of local earthquakes and includes analysis of seismic attenuation using the body wave spectra of local earthquakes, local earthquake seismic velocity tomography, and earthquake source parameter analysis including focal mechanisms and seismic moment. Knowing the physical state of the subducting plate interface is important for the slow slip modeling, and our attenuation and velocity tomography models will be key to infer the physical properties and structure in the area where slow slip occurs. For example, recent work revealed large differences between SSE slip inversions that assume homogeneous elastic properties versus those that utilize a more realistic elastic structure (Williams and Wallace, 2015). ■


")
")
")
")
")
")


")
")
")
")
")
")
")