Slow slip and future earthquake potential in New Zealand and Cascadia


Noel Bartlow (University of Missouri), Laura Wallace (UT Austin & GNS Science), Ryan Yohler (University of Missouri), and Charles Williams (GNS Science)

The New Zealand and Cascadia subduction zones are two GeoPRISMS primary sites that have captured the interest of geophysicists from around the world. Both subduction zones feature significant geological hazards, including the potential for large earthquake ruptures and tsunamis. In New Zealand, the capital city of Wellington sits directly atop a large patch of the main subduction plate interface which is frictionally locked, with the potential to rupture in future earthquakes. In Cascadia, there is also potential for a large earthquake on the main subduction interface, which may impact cities such as Portland, OR and Seattle, WA.

Both New Zealand and Cascadia also host slow slip events (SSEs). Slow slip events consist of slip on the subduction plate interface – just as would occur in an earthquake – except the slip takes place more slowly than it would during an earthquake. Now that slow slip events are widely recognized at many subduction zones, it is critical to better understand their role in the accommodation of plate motion. Many questions also exist regarding implications of slow slip for subduction zone mechanics, and the relationship between slow slip events and seismic slip events on the plate boundary.

In New Zealand, slow slip events have been shown to trigger regular earthquakes up to magnitude 6 (e.g. Wallace et al., 2017). Additionally, some evidence exists from the 2011 Tohoku-Oki Mw 9.0 earthquake (e.g. Ito et al., 2013) and the 2014 Mw 8.1 Iquique earthquake (Ruiz et al., 2014) that slow slip events may be able to trigger damaging megathrust events. Most slow slip events do not trigger earthquakes and we currently cannot differentiate slow slip events that might trigger large earthquakes from those that will not. It is possible, however, that further study will lead to methods that allow slow slip events to be used as reliable earthquake precursors.

PIs Noel Bartlow (Univ. of Missouri) and Laura Wallace (UTIG), along with collaborator Charles Williams (GNS Science New Zealand) and graduate student Ryan Yohler (Univ. of Missouri) are studying slow slip events and frictional locking in New Zealand and Cascadia.

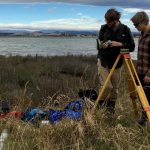
One goal of the project is to create self-consistent catalogs of slow slip events in both subduction zones that capture the time varying behavior of slow slip, including how these events grow and decay and move along the subduction plate interface. The data used for these models consists of land-based geodetic GPS time series, and in New Zealand, we also use vertical deformation of the seafloor recorded for one slow slip event using absolute pressure sensors (Wallace et al., 2016).

Previous time varying slow slip event modeling studies usually assume a uniform, elastic half-space (e.g. Bartlow et al., 2014). These new models utilize spatially-varying elastic properties within the earth based on seismic velocity models in both New Zealand and Cascadia, calculated using the PyLith finite element code. This leads to more accurate models of slip during slow slip events, and therefore, more accurate estimates of the amount of slip taken up in slow slip as opposed to being available for release in future earthquakes. Preliminary models for both New Zealand (Williams et al., 2017) and Cascadia (Bartlow et al., 2017) were shown at the American Geophysical Union 2017 Fall meeting. Additionally, a time-dependent model incorporating both onshore GPS and offshore pressure measurements for the 2014 Gisborne, New Zealand slow slip events was shown at the meeting by graduate student Ryan Yohler (Yohler et al., 2017). This model is shown in Figure 1. This slow slip event occurred near the locations of two historical 1947 earthquakes that caused damaging tsunami waves. This is the first time that seafloor geodetic data have been used in a time-dependent deformation model.

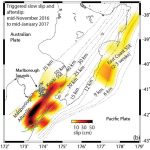
As part of this project, a team led by Laura Wallace, including Bartlow and other collaborators, have recently reported the occurrence of a large, shallow (<15 km), two-week slow slip event at the Northern Hikurangi margin triggered dynamically by passing seismic waves from the November 2016 magnitude 7.8 Kaikōura earthquake, over 600 km away (Fig. 2; Wallace et al., 2017). Long-duration (>1 year), deep (>25 km) slow slip was also triggered at the southern Hikurangi margin (Kapiti region), and afterslip occurred on the subduction interface beneath the northern South Island of New Zealand (Fig. 1).

Triggered slow slip at southern Hikurangi is more likely due to large static stress changes induced by the Kaikōura earthquake, given that area’s closer proximity to the earthquake (Wallace et al., 2018). Prior studies had already identified cases of slow slip events triggering earthquakes, and nearby earthquakes prematurely stopping ongoing slow slip events, but these studies are the first to show that dynamic and/or static stress changes from passing seismic waves may also trigger large-scale, widespread slow slip events. We are still discovering the wealth of possible complex interactions between slow slip events and earthquakes, and what they might mean for hazards. ■

References

Bartlow, N.M., C.A. Williams, L.M. Wallace, (2017), Building a catalog of time-dependent inversions for Cascadia ETS events. In AGU Fall Meeting Abstracts.
Bartlow, N.M., L.M. Wallace, R.J. Beavan, S. Bannister, P. Segall, (2014), Time‐dependent modeling of slow slip events and associated seismicity and tremor at the Hikurangi subduction zone, New Zealand. J. Geophys. Res.: Solid Earth, 119(1), 734-753.
Ito, Y., R. Hino, M. Kido, H. Fujimoto, Y. Osada, D. Inazu, Y. Ohta, T. Linuma, M. Ohzono, S. Miura, M. Mishina, (2013), Episodic slow slip events in the Japan subduction zone before the 2011 Tohoku-Oki earthquake. Tectonophysics, 600, 14-26.
Ruiz, S., M. Metois, A. Fuenzalida, J. Ruiz, F. Leyton, R. Grandin, C. Vigny, R. Madariaga, J. Campos, (2014), Intense foreshocks and a slow slip event preceded the 2014 Iquique Mw 8.1 earthquake. Science, 345(6201), 1165-1169.
Wallace, L.M., S. Hreinsdottir, S. Ellis, I. Hamling, E. D’Anastasio, P. Denys, (2018), Triggered slow slip and afterslip on the southern Hikurangi subduction zone following the Kaikōura earthquake. Geophys. Res. Lett., 45, doi.org/10.1002/2018GL077385
Wallace, L.M., Y. Kaneko, S. Hreinsdóttir, I. Hamling, Z. Peng, N.M. Bartlow, E. D’Anastasio, B. Fry, (2017), Large-scale dynamic triggering of shallow slow slip enhanced by overlying sedimentary wedge. Nat. Geosci., 10(10), 765.
Wallace, L.M., S.C. Webb, Y. Ito, K. Mochizuki, R. Hino, S. Henrys, S. Schwartz, S., A.F. Sheehan, (2016), Slow slip near the trench at the Hikurangi subduction zone, New Zealand. Science, 352(6286), 701-704.
Williams, C.A., L.M. Wallace, N.M. Bartlow, (2017), Time-dependent inversions of slow slip at the Hikurangi subduction zone, New Zealand, using numerical Green’s functions. In AGU Fall Meeting Abstracts.
Yohler, R.M., N.M. Bartlow, L.M. Wallace, C.A. Williams, (2017), Constraining slip distributions and onset of shallow slow slip in New Zealand by joint inversions of onshore and offshore geodetic data. In AGU Fall Meeting Abstracts.

Reference information
Slow slip and future earthquake potential in New Zealand and Cascadia
GeoPRISMS Newsletter, Issue No. 40, Spring 2018. Retrieved from http://geoprisms.nineplanetsllc.com

Revealing the secrets of the New Zealand GeoPRISMS Primary Site


Slow slip and future earthquake potential in New Zealand and Cascadia

Slow slip and future earthquake potential in New Zealand and Cascadia

Noel Bartlow (University of Missouri), Laura Wallace (UT Austin & GNS Science), Ryan Yohler (University of Missouri), and Charles Williams (GNS Science) The New Zealand and Cascadia subduction zones are two GeoPRISMS primary sites that have...
Probing the nature of the Hikurangi margin hydrogeologic system

Probing the nature of the Hikurangi margin hydrogeologic system

Evan A. Solomon (University of Washington), Marta Torres (Oregon State University), and Robert Harris (Oregon State University) Fluid generation, migration, and pore fluid pressure at subduction zones are hypothesized to exert a primary control...
Volatile cycling through the Hikurangi forearc, New Zealand

Volatile cycling through the Hikurangi forearc, New Zealand

Jaime D. Barnes (UT Austin), Jeffrey Cullen (UT Austin), Shaun Barker (Univ. of Waikato), Samuele Agostini (Istituto di Geoscienze e Georisorse), Sarah Penniston-Dorland (Univ. of Maryland), John C. Lassiter (UT Austin), Andreas Klügel (Univ. of ...
The NZ3D Experiment – Adding a new dimension for understanding slow slip events

The NZ3D Experiment – Adding a new dimension for understanding slow slip events

MGL1801 Participants - Ryuta Aral (JAMSTEC), Stephen Ball (Univ. of Wisconsin, Madison), Nathan Bangs (UT Austin), Dan Barker (GNS Science), Joel Edwards (UC Santa Cruz), Melissa Gray (Imperial College London), Shuoshuo Han (UT Austin), Harold Leah...
IODP tackles the Hikurangi Margin of New Zealand with two drilling expeditions to unlock the secrets of slow-slip events

IODP tackles the Hikurangi Margin of New Zealand with two drilling expeditions to unlock the secrets of slow-slip events

MGL1801 Participants - Ryuta Aral (JAMSTEC), Stephen Ball (Univ. of Wisconsin, Madison), Nathan Bangs (UT Austin), Dan Barker (GNS Science), Joel Edwards (UC Santa Cruz), Melissa Gray (Imperial College London), Shuoshuo Han (UT Austin), Harold Leah...
Hikurangi Ocean Bottom Investigation of Tremor and Slow Slip (HOBITSS) - Revealing the environment of shallow slow slip

Hikurangi Ocean Bottom Investigation of Tremor and Slow Slip (HOBITSS) - Revealing the environment of shallow slow slip

Susan Schwartz (UC Santa Cruz), Anne Sheehan (University Colorado, Boulder), Rachel Abercrombie (Boston University) In the last fifteen years, it has become evident that slow slip events (SSEs) are a common and important part of the subduction process....
Sizing up the Taniwha: Seismogenesis at Hikurangi Integrated Research Experiment (SHIRE)

Sizing up the Taniwha: Seismogenesis at Hikurangi Integrated Research Experiment (SHIRE)

Jeff Marshall (Cal Poly Pomona) andJessica Pilarczyk (University of Southern Mississippi) “A Live Dragon” Beneath the Sea In Māori culture, the Taniwha is a dragon-like beast that lives beneath the water, sometimes protecting seafarers, whil...
Assessing changes in the state of a magma storage system over caldera-forming eruption cycles, a case study at Taupo Volcanic Zone, New Zealand

Assessing changes in the state of a magma storage system over caldera-forming eruption cycles, a case study at Taupo Volcanic Zone, New Zealand

Kari Cooper (UC Davis), Adam Kent (Oregon State University), Chad Deering (Michigan Tech), and collaborator Darren Gravley (University of Canterbury, New Zealand) The largest volcanic eruptions are rare events but when they occur can represent a...
SISIE: South Island Subduction Initiation Experiment

SISIE: South Island Subduction Initiation Experiment

Erin Hightower (Caltech) and Brandon Shuck (UT Austin) The South Island Subduction Initiation Experiment (SISIE) was an international collaborative active-source seismic survey of the Puysegur subduction margin conducted aboard the R/V Marcus G....

ExTerra Field Institute and Research Endeavor: Western Alps, Summer 2017


Besim Dragovic (Boise State University) Paul G. Starr (Boston College)

Subduction zone field geologists are a proud bunch. In 2011, the name ExTerra (Exhumed Terranes) was coined to describe those in the GeoPRISMS community who investigate rocks exhumed from fossil subduction zones, rocks whose evolution illuminates processes otherwise hidden beneath the surface of active subduction systems (kudos to Sarah Penniston-Dorland and Maureen Feineman for the name “ExTerra”).

Traditional field studies have often been conducted by individuals or only small groups of researchers. One fundamental aspect of this project, termed the ExTerra Field Institute and Research Endeavour (or E-FIRE for short) was to conduct collaborative fieldwork to collect materials held communally, foster broad interactions through workshops, and incorporate student exchanges among research laboratories. The E-FIRE group consisted of researchers (including seven PhD students and three postdocs) from nine U.S.-based universities and research institutions, each with different analytical expertise in metamorphic petrology and geochemistry (e.g. stable isotopes, geochronology, thermodynamic modeling).

In addition, ExTerra partnered with a sister European organization, the ZIP project (Zooming In between Plates). The ZIP project, coordinated by Philippe Agard, consists of researchers from twelve universities across Europe with support from a number of different industry partners. The project has been running since 2013, with many of the twelve PhD students being in the final stage of their projects when we arrived in the field this summer.

The overall big picture of this project was to trace the cycle of rocks and fluids through the subduction process. For this, we proposed to go to the Earth’s premier example of a fossil subduction zone – the Western Alps, Europe in the summer of 2017.

Planning and logistics

Weekly Google Hangouts offered the early stage researchers an opportunity to discuss papers on Western Alps geology and conduct webinars on analytical techniques, modeling, and field observation. In addition, an important component of the E-FIRE initiative was to have open, collaborative documentation and data sharing, with the end goal of opening the complete sample and data collection to any future researchers interested in subduction zone research. Hangout sessions before fieldwork included discussion with Frank Spear about the use of MetPetDB (a global database of various metamorphic petrology data) and with members of SESAR (System for Earth System Registration) about utilizing International Geo Sample Numbers (IGSNs – unique numbers and barcodes given to each sample).

One of the first major steps in the E-FIRE project was the first joint E-FIRE-ZIP workshop/retreat held in the Marin Headlands, close to San Francisco, in December 2016. This was the first time many of us had met in person. It provided a great opportunity for everyone to get to know each other. We also got to see some of our first subduction zone rocks together during a mini fieldtrip to nearby outcrops of eclogites and blueschists of the Franciscan Complex. It was also exciting to have such a large group of young researchers, from across North America and Europe!
Much of the credit for the fieldwork planning and organization must go to the E-FIRE PI triumvirate of Matt Kohn, Maureen Feineman, and Sarah Penniston-Dorland, as well as our main European collaborators Philippe Agard, Marco Scambelluri, Othmar Müntener, Samuel Angiboust, and their students.

E-FIRE Group Fieldwork overview – 7/26/17 – 8/6/17

This would turn out to be a different field experience for many of us. At any one time, there were 25-30 of us in the group, including our European collaborators. For a majority of the time, we stayed in Italian hostels and rifugios with beautiful mountain vistas (I know what you’re thinking…rough stuff). Thankfully, it just so happens that many of the world’s premier metamorphic rocks are associated with many of the Alp’s premier mountains: the Matterhorn, the Dent Blanche, and Monviso. Lunchtime in the field would often consist of grab bags of breads, cheeses, and cured meats from the local market (don’t worry, we ate some fruits and vegetables).

After a few close scares with delayed flights, everyone arrived safely in time for our first group E-FIRE dinner in Geneva. The next morning, we headed off for our first day in the field, consisting of an introduction to Alpine geology with rapid-fire stops along the way driving from Geneva to the Aosta Valley in Italy. This part of the trip was led by Alpine geology maestro, Philippe Agard, who demonstrated an incredible ability to explain complex Alpine features whilst hand-drawing cross-sections in front of some fantastic Alpine vistas.

No trip to the Alps would be complete without a hard slog up some steep mountainous terrain and our second day in the field delivered just that! Having hiked up some 1200 m of relief (most of us still suffering from jetlag), we were rewarded with spectacular views and some equally exciting geology in the Dent Blanche area. This area is interpreted to be a well-exposed example of an ancient subduction interface, where continental material of the colliding overlying plate is juxtaposed against the lower plate of European affinity. Recent work by some of our European collaborators, led by Samuel Angiboust, has suggested that this could be one of the best natural analogues for a subduction zone interface near the base of the upper plate crust.

Our third day started with an immaculate view of Monte Cervino (or it’s more well-known German name, Matterhorn). A beautiful mountain-side trail took us up to Lago Di Cignana, an artificial lake located in Valtournenche, in the Aosta Valley. This site is most well known as an ultra-high pressure (UHP) locality, consisting of various coesite (high-pressure polymorph of quartz)-bearing eclogites and schists. Recent work has found evidence for micro-diamonds within fluid inclusions in garnet, suggesting that these rocks were buried to depths greater tha 100 km and potentially provide a unique record of processes occurring deep within the subduction zone.

The next day consisted of a transect across the Schistes Lustres – one of the most complete sections across a fossil accretionary wedge complex consisting of blueschist and eclogite facies metasediments. The fieldwork was punctuated by brief outbursts of some stormy Alpine weather (thankfully one of the only rainy days in the whole trip!).

Day 5 featured a trip to the Lanzo Massif and a shift in focus from the processes operating during Alpine orogenesis to those occurring on the seafloor, prior to subduction. In contrast to many of the Alpine ophiolites seen on this fieldtrip, the Lanzo Massif has largely escaped metamorphic overprinting. Our leader for this day, Othmar Muntener, showed us well-preserved examples of seafloor serpentinisation and discussed the evidence for Lanzo, and some other Alpine ophiolites, belonging to an ultra-slow spreading ridge system. Of particular interest to the group was discussion of evidence for subducted sub-continental lithospheric mantle that would have been exhumed to the seafloor along large-scale detachment faults as part of a slow-spreading ridge system.

For many of us, one of the highlights on the trip was the Monviso area, in the Italian Alps. The two-day trip featured a tour around one of the best exposed fragments of subducted oceanic material, interpreted as a coherent slice of the oceanic crust/mantle interface. Whilst the hiking around the area featured some fantastic vistas of Monviso and the adjacent peaks, it was perhaps equally memorable for the dense clouds that would appear out of nowhere and reduce the visibility to just a few meters. Perhaps unsurprisingly, given a group of thirty geologists easily distracted by the rocks, we managed to lose some of the group in the fog! After about a thirty-minute search, and a lot of shouting and whistling, the lost E-FIRE folks were located – already on their way to the Rifugio for an early happy hour.

After the Monviso trip, we took a field break to decompress and to discuss the nascent project ideas the students and postdocs were thinking about in the context of the sites we had visited. It was exciting to hear students bouncing ideas off each other and contemplating how each of their individual projects goals will tie into each other’s. We smell collaboration (and field boots)!
After a well-needed day of rest and relaxation, we drove east to the Ligurian Alps, with the port city of Genoa as our base of operations over the next three days. Here, we drove north, as the serpentinite guru, Marco Scambelluri, led us into the Voltri Massif. In this portion of the Western Alps, it is suggested that convergence between Europe and Apulia occurred at an ocean-ocean plate interface (as opposed to northwest at Monviso, which is suggested to be ocean-continent). We got to contemplate whether changes in plate dynamics here would have resulted in differing metamorphic conditions and preservation of buried lithologies. Our first day was an introduction to the regional geology, and a quick introduction to fieldwork closer to the Mediterranean, with temperatures at times in excess of 100˚F. Much of the terrane is heavily vegetated, so the best field exposures were in riverbeds, like those of the Gorzente River, in the Erro Tobio Unit. The Erro Tobio Unit consists of variably serpentinized ultramafic rocks, with the most striking feature in these rocks being coalescing veins of metamorphic olivine resulting from dehydration during subduction.

The next day, Marco led us to several roadside locations in the Beguia Unit of the Voltri Massif, a region of large (tens to hundreds of meters) lenses of metamorphosed gabbro in a matrix of serpentinite. It has been hypothesized that these lenses may represent a tectonic mélange or simply an extension of what we all observed earlier in the trip. The temperature that day did not let up, and hammering dense Fe-Ti meta-gabbros did not provide a break either (pun intended), but we collected some spectacular samples and witnessed Marco’s expert wielding of a sledge hammer. At the end of days like this, a cool refreshment is always welcome, as well as a nice stroll along the rocky coast of Genoa.

Small Group Fieldwork | 8/8/17 – 8/28/17

Groups of researchers went back to Monviso to collect more stunning examples of slab/mantle fluid-rock interaction, to Dent Blanche for finer-scale sampling of the subduction interface, and out by ferry to explore an extension of the high-pressure Western Alpine rock in Corsica. The authors, with a group of others, went back to the Voltri Massif for more sampling of meta-gabbros and serpentinites, but also to the Apennines, where relics of unsubducted gabbro and serpentinite are preserved. There, we experienced two firsts: tripe (with mixed responses!), and having the carabinieri (the Italian military police) called on us for hammering rocks. This time with smaller groups going back to some of the same locations we visited earlier in the trip, the focus was on more detailed sampling for individual project goals, and expanded discussion of field observations and any tectonic interpretations.

After several days in smaller teams, the E-FIRE group was re-assembled back in Geneva, Switzerland for one more day, and what could possibly beat the adventures we experienced in the field? Why, it’s sample packing! In a parking lot at the Université de Lausanne, we showed each other some of the rocks we collected for our projects, and in some cases, samples we set out to collect for each other’s projects. Samples were packed onto a pallet and wrapped like no rocks had ever been wrapped before. That night, we had one final group dinner in Geneva before we all split up again, where many were back out into field and others were off to the Goldschmidt conference in Paris.

All told, roughly 700 kg of rock was collected by the E-FIRE group during the field excursion, and shipped to Penn State University where the samples will be held in a sample repository. This is of course until we crush, pick at, dissolve, and shoot lasers at them. In all seriousness, it is safe to state that the 2017 ExTerra Field Institute and Research Endeavour was the experience of a lifetime, especially for the early stage researchers; a unique opportunity to interact and initiate collaborations with each other and our new European colleagues, observe and contemplate subduction zone processes in a classic field location, and travel through one of the most beautiful terranes on Earth.

Acknowledgments

We are grateful to Philippe Agard, Marco Scambelluri, Othmar Müntener, and Samuel Angiboust (along with other European students, postdocs, and research scientists) for their guidance in field logistics and immense knowledge of Western Alps geology. We would like to thank the principal investigators Matt Kohn, Sarah Penniston-Dorland, and Maureen Feineman for the leadership and organizational skills necessary for such a large field-based research endeavor. We finally thank W.O. Bargone for field assistance. This field institute was supported by NSF EAR-1545903 and readers like you. ■

“Report from the Field” was designed to inform the community of real-time, exciting GeoPRISMS -related research. Through this report, the authors expose the excitement, trials, and opportunities to conduct fieldwork, as well as the challenges they may have experienced by deploying research activities in unique geological settings. If you would like to contribute to this series and share your experience on the field, please contact the GeoPRISMS Office at info@geoprisms.nineplanetsllc.com. This opportunity is open to anyone engaged in GeoPRISMS research, from senior researchers to undergraduate students.
We hope to hear from you!

Reference information
ExTerra Field Institute and Research Endeavor: Western Alps, Summer 2017. B. Dragovic, P. Starr
GeoPRISMS Newsletter, Issue No. 39, Fall 2017. Retrieved from http://geoprisms.nineplanetsllc.com

Magnetotelluric and Seismic Investigation of Arc Melt Generation, Delivery, and Storage beneath Okmok Volcano


Kerry Key (Scripps Institution of Oceanography) and Ninfa Bennington (University Wisconsin-Madison)

It all sounded so easy when we were writing the proposal. Sure, we can deploy 54 seafloor magnetotelluric (MT) instruments around a remote Aleutian island, no problem, we have done lots of marine MT surveys before. Add on an array of onshore magnetotelluric and passive broadband seismic stations covering the flanks and caldera of a volcano that erupted without almost no warning back in 2008? Sure, that won’t be too hard either since we will have a helicopter transporting the field teams and science equipment, and we can base our camp at a remote cattle ranch used by previous field teams studying Okmok volcano. So we worked up a budget, wrote the proposal text and submitted it to the July 2014 target date for proposal submissions to the National Science Foundation’s GeoPRISMS program.

Fast forward to early January 2015 when we received an email from Bil Haq, then one of the two NSF Program Managers for GeoPRISMS, stating “Your proposal did well in the competition for GeoPRISMS funds and I plan to fund it at this time”.

Yes!!!!! Woohoo!!!!!! Seriously, this was good news.

Then comes the word that the field work will start in mid-June. We were supposed to get everything in place for two short cruises and three weeks of onshore field work in just a few months. Time to get moving!

The Logistics

We started a seemingly endless chain of emails and conference calls to work out the logistics for the onshore field work. We would be working out of a field camp at Bering Pacific Ranch on the abandoned WWII military base Fort Glenn, located on the eastern flank of Umnak island. Our tasks were to get a helicopter, about fifty barrels of helicopter fuel, seismometers, magnetotelluric instruments, cooking supplies and food for about 160 person-days delivered by the start of field operations around June 20th. The tiny city of Dutch Harbor, conveniently located about 100 km away on neighboring Unalaska Island, is the country’s largest fishing port by volume, so we planned to ship our stuff from the lower 48 states up to Dutch Harbor, where it would be consolidated and then shipped to Fort Glenn. Easy right?

Amazingly, this plan actually worked out. Once all the geophysical equipment, batteries, helicopter fuel, non-perishable food and cooking supplies arrived in Dutch Harbor, it was loaded onto the Island Packer, a small landing craft, and then ferried on a 60-km journey from Unalaska Island to a makeshift dock at the beach near Fort Glenn. Then two ranch hands transported it 5 km up to the field camp at the ranch.

By comparison, preparing for the marine part of the project was relatively straightforward since the Scripps lab does this routinely and all we had to do was get the marine MT equipment to the ship. By coincidence, our deployment cruise was scheduled on the RV Thompson, which happened to be passing through San Diego on its way north, so we lucked out and loaded the marine MT gear onboard for a free ride up to the Aleutians.

June 16-17, 2015 | Making it to Dutch Harbor

Dutch Harbor was also the port of departure for the marine MT deployment cruise so we flew into Anchorage and then boarded connecting flights to Dutch Harbor. While anywhere else in the US this would likely be an easy connection, flights to the Aleutian islands are unpredictable due to frequent low hanging clouds and fog. When the planes take off in Anchorage, they don’t know how the weather will be in Dutch Harbor so they load enough fuel on board to make the return trip if visibility is so bad they can’t see the Dutch Harbor runway. This was indeed the case for several of our connecting flights, and so it took a few attempts spread out over a few days for everyone to finally make it to Dutch Harbor. At the local grocery store Safeway, which was unexpectedly well stocked with a cornucopia of fresh produce, we gave the manager a lengthy shopping list of fresh produce, dairy, meat and seafood and he promised it would be delivered to the airport on the morning of June 22, where it would be loaded onto the charter flights taking us west to Fort Glenn.

June 18-21, 2015 | Deployment Cruise

We pushed off the dock around mid-day on the 18th and by 01:00 on the 19th the ship arrived at the first station, located on the northern end of the survey profile in the Bering Sea. By 10:00, we had already deployed seventeen seafloor MT receivers. The sky was filled with low hanging clouds so we couldn’t see Umnak Island, but the lack of view was made up for by the lack of wind and almost no swell – perfect conditions for the maiden marine flight of our consumer-grade drone, allowing us to capture some 4K high definition videos of ship and the science team deploying MT receivers. While waiting in port during the previous days, we had done a lot of prep work, including putting batteries in the 54 data loggers for the MT receivers, synchronizing their crystal oscillator clocks with GPS time and programming them to startup around the time we predicted they would be on the seafloor. So now for each receiver deployment, all we had to do is mount the magnetic field induction coil sensors on the receiver frame along with the two long electric dipole arms, attach the external electronic compass, plug in all the sensor cables, secure the concrete anchor strap, test the acoustic release system, test the stray-line buoy’s radio and finally attach the bright orange flag to the frame. There is a well-developed procedure for all these steps and checklist to make sure nothing is skipped, so it all goes like clockwork thanks to the careful efforts of the students, postdocs and technicians working either the noon-to-midnight or midnight-to-noon shifts (ship-time is not cheap so the vessel works 24 hours a day).

The clouds partially lifted in the late afternoon of the 19th as we entered Umnak Pass, a narrow channel that separates Umnak Island on the west from Unalaska Island on the east. The MT deployment carried on like clockwork and by the 20th we were making way into the Pacific Ocean, which was starting to kick up with strong winds and some moderate swell. We finished the last MT deployment about twelve hours ahead of schedule so we decided to use the extra time to collect high resolution multibeam bathymetry on the forearc slope before heading back to Dutch Harbor. Our journey back to port went about the northern shore of Unalaska, and with luck the clouds lifted partially to give some nice views of Mount Makushin volcano. As usual, soon after the ship tied up most of the crew and science party headed to the local bar to re-equilibrate after a few days on a dry ship.

June 21-July 8, 2015 | Onshore field work

The next phase of the project started with flights from Dutch Harbor to Fort Glenn that transported the science party, two ranch hands, and the perishable food that Safeway had just delivered. From the gravel landing strip (left over from WWII) at Fort Glenn, a ranch hand drove the science party and food up to the camp house where we would stay. The camp house was basically three trailer units arranged in a u-shape with an aluminum roof overtop and a giant garage door on the open side of the U. One unit was a cooking trailer with full kitchen and dinner area. Another was a bunk house and the third was a bathroom, shower and laundry facility. While we weren’t going to exactly be roughing it, nobody had stayed here in several years and everything was covered in mold and black volcanic dust, and the window sills were graveyards of giant fly corpses. We spent much of the first day cleaning up the place, stocking the kitchen and setting up workbenches for the geophysical equipment in the enclosed space in the middle of the three trailers. Sometime during the first day the helicopter arrived and everything was coming together for us to begin operations the next day.

Our seven-person science team would helicopter into and around Okmok volcano. Half of the crew carried out an onshore magnetotelluric survey collected in an array using a combination of long-period and wide-band MT systems, with nineteen stations within the caldera and ten stations outside. The remainder of our field team installed thirteen temporary broadband seismometers both in and around the volcano. The temporary seismic array recorded seismic data until its retrieval in summer 2016. In tandem with the Alaska Volcano Observatory’s twelve permanent seismic stations, there were twelve seismic instruments within/at the rim of the caldera and fourteen seismic instruments outside the caldera.

Both the seismic and MT teams operated in parallel so the helicopter went back and forth ferrying the teams around. That meant we always had to be prepared to be left overnight (or longer) at field stations if the fog came in and the helicopter couldn’t return to pick us up (luckily this never happened, despite a few close calls). We also had to be prepared for being chased by one or more of the ~7000 feral cattle that roam the outer flanks of the caldera. We quickly developed a protocol where after dropping off a team, the helicopter would fly in a 1-km circle around the station chasing away any nearby cattle. Despite this, there was an occasion where the seismic team had to make haste into a ravine to get away from an angry bull. While the MT systems only needed to record data for a few days and thus were all recovered by the end of the first field season, the broadband seismic systems were going to record seismic waves for the next year and would be picked up during the second field season.

July 9-14, 2015 | Recovery cruise

For the marine MT recovery cruise, we were on a different ship, the newly built RV Sikuliaq. Recovering the marine MT receivers meant driving up to them in the ship, sending an acoustic command that tells the instrument to let go of its anchor and then waiting for the instrument to rise to the sea surface. Once on the surface, the instrument’s stray line buoy radios the ship with its GPS position. The ship then drives up to the floating instrument from the downwind side and once its alongside the ship, we toss a grapnel around the stray line and use that to attach the instrument to the ship’s remotely operated crane, which then lifts it aboard. We successfully recovered all instruments except one that was deployed in a dicey location in Umnak Pass where there were strong currents that we suspect carried the instrument away after it released its anchor.

July 29 – Aug 6, 2016 | Recovery of seismic instruments

In summer 2016, we returned to Umnak Island to recover the seismic instruments. This time our operations were based on marine vessel Maritime Maid. Operations continued in a similar fashion to the previous field season with helicopter providing the team’s transportation to and from Okmok. However, this year there was an added level of excitement as take-offs and landings were carried out on the ship’s small helipad. Due to unusually cloudless blue skies and warm temperatures, we demobilized all thirteen seismic sites in a matter of several days. Amazingly, and quite happily, we found that the majority of stations were still up and running when returning to the sites for demobilization. After a rapid and successful field season, we departed from the wonderful Maritime Maid crew and made our way back home. ■

“Report from the Field” was designed to inform the community of real-time, exciting GeoPRISMS -related research. Through this report, the authors expose the excitement, trials, and opportunities to conduct fieldwork, as well as the challenges they may have experienced by deploying research activities in unique geological settings. If you would like to contribute to this series and share your experience on the field, please contact the GeoPRISMS Office at info@geoprisms.nineplanetsllc.com. This opportunity is open to anyone engaged in GeoPRISMS research, from senior researchers to undergraduate students.
We hope to hear from you!

Reference information
Magnetotelluric and Seismic Investigation of Arc Melt Generation, Delivery, and Storage beneath Okmok Volcano. K. Key, N. Bennington
GeoPRISMS Newsletter, Issue No. 38, Spring 2017. Retrieved from http://geoprisms.nineplanetsllc.com

Imaging Magma Under Mount St. Helens with Geophysical and Petrologic Methods


Carl W Ulberg1 and the iMUSH Team*

*The iMUSH team includes Geoffrey A Abers2, Olivier Bachmann3, Paul Bedrosian4, Dawnika L Blatter4, Esteban Bowles-Martinez5, Michael A Clynne, Kenneth C Creager1, Kayla Crosbie2, Roger P Denlinger⁴, Margaret E Glasgow⁶, Jiangang Han1, Steven M Hansen⁶, Graham J Hill⁷, Eric Kiser⁸, Alan Levander⁹, Michael Mann2, Xiaofeng Meng1, Seth C Moran⁴, Jared Peacock⁴, Brandon Schmandt⁶, Adam Schultz⁵, Thomas W Sisson⁴, Roque A Soto Castaneda2, Weston A Thelen⁴, John E Vidale1, Maren Wanke3

1University of Washington, 2Cornell University, 3ETH-Zurich, ⁴USGS, ⁵Oregon State University, ⁶University of New Mexico, ⁷University of Canterbury, ⁸University of Arizona, ⁹Rice University
iMUSH is funded by NSF-GeoPRISMS, NSF-Earthscope with substantial in-kind support from the USGS.

The imaging Magma Under Mount St. Helens (iMUSH) experiment aims to illuminate the magmatic system beneath Mount St. Helens (MSH) from the subducting Juan de Fuca Plate to the surface using multiple geophysical and petrologic techniques. Field work involved seventy broadband seismometers deployed from 2014 to 2016, 23 active shots set off in the summer of 2014 recorded at about 5000 sites with Texan instruments and 950 additional Nodal stations, 150 new magnetotelluric measurements, and new petrologic sampling and analysis (Fig. 1).

Figure 1. Left: Map of the active source deployment. In the summer of 2014, 23 shots were recorded by about 2500 Texan seismometers installed in two deployments, in addition to 950 Nodal seismometers. The black line shows the location of cross-sections in Figure 2. Right: Locations of permanent and temporary broadband seismometers used in the passive source experiment, magnetotelluric sites, and petrologic samples.

In June 2017, about twenty iMUSH scientists met at the USGS Cascades Volcano Observatory in Vancouver, WA, to discuss emerging iMUSH results and to integrate those results into a consistent model of the crust and upper mantle under Mount St. Helens. Some results have been published already and many more are on their way to publication.

Passive seismic techniques include local earthquake tomography, ambient noise tomography, receiver function imaging, attenuation tomography, and SKS anisotropy. Using these techniques, we can image portions of the crust and mantle from the subducting slab to the surface, at varying degrees of resolution. Principal investigators for this portion of the experiment are Ken Creager, Geoff Abers, and Seth Moran, plus several students mentioned below.

Local earthquake tomography imaging is limited to the upper 20 km of the crust. Using more than 10000 first arrival picks for P- and S-waves from 400 local earthquakes, Carl Ulberg imaged surface-mapped features such as several high-velocity Miocene plutons, and the low-velocity Indian Heaven volcanic field and Chehalis sedimentary basin. Deeper features include the low-velocity Mount St. Helens seismic zone (SHZ), and low velocities at depths of 6-15 km below sea level beneath MSH, possibly related to a shallow magma storage region that has been identified previously with seismic studies and constrained by petrology (Fig. 3; Scandone and Malone, 1985; Lees and Crosson, 1989; Waite and Moran, 2009).

Ambient noise tomography involves cross-correlating the seismic noise between all of the station pairs in the array, and inverting the phase velocity maps to obtain a 3-D shear wave model of the crust and upper mantle. Using this technique, Kayla Crosbie found a general trend of high velocities in the lower crust to the west of MSH, and lower velocities to the east. This could be related to the presence of the accreted Siletz terrane (oceanic basalt from ~50Ma) to the west, and/or high temperatures and partial melt in the lower crust to the east (Fig. 2).

Receiver functions record the arrival of reflected and converted waves from teleseismic earthquakes. This technique is useful for locating interfaces with strong velocity discontinuities, since these reflect waves efficiently. Using this technique, Michael Mann imaged the subducting Juan de Fuca slab at a depth of ~70 km beneath MSH, and ~100 km beneath Mount Adams, almost 50 km to the east. Roque Soto used teleseismic attenuation tomography to model attenuation in the area around MSH. Abe Wallace and Erin Wirth used shear wave splitting of SKS phases to infer a fast direction of anisotropy aligned NE-SW, consistent with regional trends.

The active source experiment has yielded several results including 2-D Vp and Vs profiles through MSH down to the Moho, a map of the reflectivity of the Moho beneath MSH, and details of the locations and characteristics of seismic sources beneath MSH.

Using thousands of observations of the 23 active shots, Eric Kiser and Alan Levander obtained 2-D seismic velocity profiles through MSH (Kiser et al, 2016), and are working on a 3-D inversion of the same data.

The model includes a low-velocity zone in the lower crust 10-20 km SE of MSH, hypothesized to be a potential magma storage region as magma makes its way from the mantle to be erupted at MSH. This low-Vp zone corresponds spatially with the low-Vs zone imaged with ambient noise tomography (Fig. 2). High Vp/Vs regions in the upper crust beneath MSH and Indian Heaven could correspond to areas with partial melt, at active Holocene eruptive centers. The 3-D active source seismic imaging reveals similar features in the upper 15-20 km as imaged by the local earthquake tomography (plutons, sediments, etc.).

Figure 2. Top: NW-SE cross-section through MSH and the Indian Heaven volcanic field (IH) from Kiser et al (2016), showing high Vp (H1, H2), low Vp (L1) and high Vp/Vs anomalies (F1, F4). White dots are earthquakes during the first 24 h following the 18 May 1980 eruption, red squares are deep long-period event locations since 1980, white stars are active shot locations. Bottom: Cross-section along the same NW-SE line through the ambient noise tomography Vs model. High and low velocities in the lower crust are in similar locations as the active source model. The dotted line is the location of the Moho in the upper panel.

During the active source experiment, 950 Nodal stations were deployed for two weeks on and around the edifice of MSH. Steve Hansen and Brandon Schmandt stacked these data to reveal details of the reflectivity of the Moho, the boundary at the base of the continental crust (Hansen et al, 2016). They found large amplitude reflected waves to the east of MSH but little evidence for reflected waves to the west. This indicates that there is a stronger velocity contrast between the lower crust and upper mantle to the east of MSH than to the west. This could be related to the presence of a serpentinized mantle wedge, which would lower the velocity of the upper mantle. Due to its lower temperature, this probably also precludes the possibility of magma derived from the mantle wedge directly beneath MSH. Instead, it would have to come from somewhere to the east, an idea also supported by the active seismic and noise cross-correlation results.

Using the dense instrumentation on and around MSH, seismic sources can be better-characterized as well. Deep long-period earthquakes have been observed beneath MSH since sufficient instrumentation was installed around the time of the 1980 eruption. Using cross-correlation techniques, Jiangang Han determined that almost all of these events actually occurred in the same place, a location ~5-10 km SE of MSH at a depth of 22-30 km below sea level. Margaret Glasgow, Hansen, and Schmandt worked with the Nodal data to locate and characterize an order of magnitude more shallow events than were in the Pacific Northwest Seismic Network catalog. Xiaofeng Meng and John Vidale obtained a high-resolution set of seismic locations within 5-km depth of MSH with double-difference relocations using accurate 3-D velocity models.

The iMUSH magnetotelluric experiment, led by Adam Schultz (OSU) and Paul Bedrosian (USGS), collected data at 150 sites within the broad area encompassing Mounts St. Helens, Rainier, and Adams. These data were supplemented by a denser set of data collected ~10 years previously in the immediate area around MSH (Hill et al, 2009). A primary aim of the magnetotelluric study is to obtain a more detailed image of what has been termed the Southwest Washington Cascades Conductor (Stanley et al, 1987). Three-dimensional resistivity modeling by Jared Peacock, Esteban Bowles-Martinez, Bedrosian and Schultz imaged a ring of high conductivity extending NNW from MSH, east under the Cowlitz River, south along the western edge of the Cascades arc, and west beneath Indian Heaven.

Much of the high conductivity overlaps with low velocities imaged by seismic tomography (Fig. 3). The origin of the high conductivity is somewhat enigmatic. One theory is that the high-conductivity reflects contact metamorphism of Eocene marine sediments along the margins of a large Miocene intrusion, emplaced in or near the suture zone between the Siletz terrane and the Mesozoic North American margin. That Mount St. Helens sits directly atop this conductive ring may shed light on both its unusual forearc location and predominantly dacitic composition. A more subtle conductor imaged within the lower-crust may be related to a small degree of partial melt which may in turn source surface volcanism.

Figure 3. Left: Magnetotelluric model at 7km depth, showing details of high conductivities between MSH, Mount Rainier and Mount Adams (black outline). Scale is log10 (resistivity), so red areas are highly conductive. Triangles are volcanoes. Right: Local earthquake tomography Vp model at the same depth, showing percent variation from a 1-D average velocity model, masked for areas without raypaths. Several low-Vp anomalies coincide spatially with high conductivities in the MT model (black outline shows high conductivity).

Petrologic studies conducted on rocks collected near MSH have revealed several new insights into the magmatic system. Three mafic endmembers are encountered at MSH: high-K basalts (Type 1), low-K basalts (Type 2), and arc-type basaltic andesites (Type 3). The distinct geochemical characteristics of each mafic type require variable contributions of flux and decompression melts, involving different sources in the mantle, possibly including asthenospheric upwelling through a slab tear or gap beneath northern Oregon (Obrebski et al, 2010). The preservation of their mantle signatures requires separate ascent pathways through the crust (likely along re-activated fractures) for distinct batches of basalt aside from the main plumbing system. Further, petrographic observations made by Maren Wanke, Olivier Bachmann, and Michael Clynne indicate frequent mixing of some basalt types with the silicic upper part of the system, producing magmatic cycles of basalt entraining a dacitic magma reservoir, mixing, fractionating and erupting the diverse magmas of the Castle Creek period (~1900-1700 years B.P.). However, dacites are the most abundant rock type at MSH and the eruption of basalt remains a rarity. Hydrous arc-type basaltic andesite (Type 3), presumably the most abundant type of mafic magma produced in the mantle, is likely feeding the main magmatic plumbing system to form dacites in a lower crustal mush zone, which is possibly being imaged by the active source, ambient noise, and magnetotelluric studies.
Two voluminous dacitic tephra units from MSH over the last 4 ka were also sampled and studied using near-liquidus, fO2-buffered inverse experiments over a range of pressures, temperatures and H2O concentrations (Blatter et al, 2017).

The results of these experiments indicate that the dacite liquid is generated at deep crustal pressures (700-900 MPa, ~20-35 km) and moderate temperatures (925°C), with high H2O concentrations (6-7 wt%) and high fO2 (~NNO+1.3). Mass balance calculations using the mineral and liquid compositions from the experiments indicate that crystallization of an H2O-rich basaltic andesite (similar to Type 3), or re-melting a vapor-charged hornblende gabbro can generate large quantities (~35 wt%) of hydrous dacite, implying that regular recharge of the system by H2O-rich basalts, basaltic andesites, or vapor is necessary for the persistent production of dacitic melt consistent with the eruptive history of MSH.

Figure 4. Schematic cross-section through the crust and mantle beneath MSH including a lower and upper crustal magma reservoir (dashed lines) inferred from low P-wave (Vp), S-wave (Vs) velocity anomalies (shaded areas) (Kiser et al., 2016) and the position of deep long period earthquakes (black dots). The outline of the upper crustal magma reservoir is inferred from earthquake locations of the 1980 eruptions (Scandone and Malone, 1985). Colored arrows indicate separate pathways through the crust for the different mafic endmembers: high-K basalts, low-K basalts and arc-type basaltic andesites. The serpentinized mantle wedge is inferred from seismic data of Hansen et al. (2016). Figure provided by Maren Wanke.

Several features are consistently observed in geophysical surveys and match inferences from petrological clues (Fig. 4). Local and active source tomography, place an anomalous region in the upper crust at depths of 5-15 km below sea level beneath MSH. The likely explanation for this is an upper crustal storage region for evolved magma, some of which will likely erupt at MSH in the future. In the lower crust, ambient noise tomography and reflected waves from active source tomography point towards a low-velocity region to the east or SE of MSH, which could be related to lower crustal magma storage. Magnetotelluric results are also consistent with a small degree of lower-crustal partial melt, although the spatial extent of such melt is not in complete accordance with that inferred from seismic tomography. Since MSH is located anomalously trenchward for a Cascades volcano, with a slab depth of ~70 km directly beneath MSH, an offset magma pathway is possible. Deep long-period earthquakes may indicate the presence of magmatic fluid along this pathway. Low velocities and high conductivity are observed along the SHZ, which could be related to higher temperatures and fractured rock, fluids, and/or the presence of metasedimentary rocks within the Eocene Siletz suture zone. Upper crustal features are also consistent across local, active source, and ambient noise tomography, giving us a better idea of the upper crustal structure of the region, including multiple Miocene-aged plutons and sedimentary basins. ■

References

Blatter, D.L., T.W. Sisson, and W.B. Hankins, (2017), Voluminous arc dacites as amphibole reaction-boundary liquids. Contributions to Mineralogy and Petrology, 172(5), 27.
Hansen, S.M., B. Schmandt, A. Levander, E. Kiser, J.E. Vidale, G.A. Abers, and K.C. Creager, (2016), Seismic evidence for a cold serpentinized mantle wedge beneath Mount St Helens. Nature Communications, 7, 13242.
Hill, G.J., T.G. Caldwell, W. Heise, D.G. Chertkoff, H.M. Bibby, M.K. Burgess, J.P. Cull, and R.A.F. Cas, (2009), Distribution of melt beneath Mount St Helens and Mount Adams inferred from magnetotelluric data. Nature Geoscience, 2(11), 785-789.
Kiser, E., I. Palomeras, A. Levander, C. Zelt, S. Harder, B. Schmandt, S.M. Hansen, K.C. Creager, and C. Ulberg, (2016), Magma reservoirs from the upper crust to the moho inferred from high-resolution Vp and Vs models beneath Mount St. Helens, Washington State, USA. Geology, 44(6), 411-414.
Lees, J., and R. Crosson, (1989), Tomographic inversion for 3-dimensional velocity structure at Mount St. Helens using earthquake data. Journal of Geophysical Research-Solid Earth and Planets, 94(B5), 5716-5728.
Obrebski, M., R.M. Allen, M. Xue, and S. Hung, (2010), Slab-plume interaction beneath the Pacific Northwest. Geophysical Research Letters, 37, L14305.
Scandone, R., and S. Malone, (1985), Magma supply, magma discharge and readjustment of the feeding system of Mount St. Helens during 1980. Journal of Volcanology and Geothermal Research, 23(3-4), 239-262.
Stanley, W., C. Finn, and J. Plesha, (1987), Tectonics and conductivity structures in the southern Washington Cascades. Journal of Geophysical Research-Solid Earth and Planets, 92(B10), 10179-10193.
Waite, G.P., and S.C. Moran, (2009), V-P structure of Mount St. Helens, Washington, USA, imaged with local earthquake tomography. Journal of Volcanology and Geothermal Research, 182(1-2), 113-122.

Reference information
Imaging Magma Under Mount St. Helens with Geophysical and Petrologic Methods. C. Ulberg and the iMUSH Team
GeoPRISMS Newsletter, Issue No. 39, Fall 2017. Retrieved from http://geoprisms.nineplanetsllc.com

Report: The Subduction Zone Observatory Workshop


Jeff McGuire1, Terry Plank2
1Woods Hole Oceanographic Institution, 2Lamont-Doherty Earth Observatory, Columbia University

On September 29-October 1 2016 an International Workshop was held in Boise Idaho to discuss what a Subduction Zone Observatory initiative could accomplish and what form it might take. The workshop was proposed by the IRIS, UNAVCO, Earthscope, and GeoPRISMS offices in response to the high level of community interest over the past years. The SZO workshop was sponsored primarily by the U.S. NSF, with support coming from eight different programs within the GEO division as well as the Office of International Science and Engineering. Additionally, the USGS supported over twenty of its scientists to attend and the Earth Observatory of Singapore supported the attendance of over fifteen scientists from a number of countries in Southeast Asia. By design, the meeting was exceptionally diverse: of the 242 scientists in attendence, 67 were early career investigators and graduate students and 45 were from 21 different countries outside the U.S.
The workshop was organized around four themes:

  • Deformation and the Earthquake Cycle;
  • Volatiles, Magmatic processes and Volcanoes;
  • Surface Processes and the Feedbacks between Subduction and Climate; and
  • Plate Boundary Evolution and Dynamics.

Thirty-two breakout sessions over the course of the meeting gave attendees abundant opportunity to weigh in on the most important scientific opportunities, the key obstacles holding back discoveries, and the types of future community scale efforts that would best advance subduction zone science. Participants were asked “What is new, exciting, and doable?” and “What can’t we do now?”. Additionally, over sixty whitepapers were submitted with ideas about what an SZO might look like and four webinars were conducted that discussed opportunities afforded at different locations around the world. The presentations, break out reports, white papers, and webinars are all available for viewing on the workshop website.

Much of the scientific enthusiasm at the workshop resulted from recent examples of spectacular new types of datasets that provide a window towards a next generation approach to understanding Subduction Zones. Many phenomena that were previously captured as static snapshots are now starting to be shown as movies, in 4D. From the locking of the plate boundary fault, to the gases expelled from volcanoes prior to eruption, to the surface mass transport between forearc mountains and the trench, to geological records of past ruptures spanning back thousands of years, newly available observational time series are revealing dynamically evolving processes.

The key to understanding both the basic science and the societal hazard requires recording this 4D evolution and being able to quantitatively model it. Synergistically, the sensors deployed for basic research are finding evermore practical applications. Earthquake and tsunami early warning, volcanic ash observatories and dispersion models linked with global air traffic control, eruption warnings based on volcanic unrest, incipient landslides detected by satellites, all rely on sensor suites that now serve the dual purpose of a greater scientific understanding and a reduction in societal hazards. The technology for studying subduction zones is exploding in many ways but this has not yet been translated to the necessary scales to accelerate discovery and improve warning systems.

Examples of timeseries data prior to earthquakes and eruptions. 8.1 Tarapaca earthquake (from Brodsky and Lay, Science, 2014) and 2014 eruption of Turrialba volcano (from deMoor et al., JGR, 2016). Timeseries show notable events in the weeks preceeding the mainshock (1 April 8.1) and eruption (pink bar), in the form of migrating swarms of foreshocks and a rise in the CO2/S ratio of gas, respectively. Such events are rarely captured, but generated excitement at the SZO Workshop as emergent phenomena that require a coordinated, multidisciplinary effort.

USGS scientists presented an overview of their plans for new research directions aimed at reducing geohazards from subduction zone eruptions, earthquakes, tsunamis, and landslides. There was considerable debate during the workshop about the relationship between basic science in subduction zones and mission-oriented science aimed at hazard reduction. An SZO initiative will undoubtedly have an impact on both and must carefully articulate its synergistic efforts with the USGS, NASA, and NOAA. In practice, there is considerable overlap between these two goals and many of the same fundamental questions and observational datasets are key to each. Moreover, it was recognized that hazard reduction will be the single most important driver of many of our international collaborators who will be critically important in making SZO a global scale initiative. Hazards will also form the key focus of many education and outreach efforts that could produce a significant impact if approached at the community scale. Overall, the workshop supported a primary driving goal of any SZO initiative to be the development of a deeper understanding of the physical and chemical processes that underlie subduction zone hazards.

The Cascadia and Alaska subduction zones lie within U.S. borders and present a pressing array of unsolved problems and opportunities in subduction zone science. Key hazards to U.S. populations drive the basic science community and the mission agencies to collaborate. However, the workshop participants also emphasized the need to go global to really understand subduction zone processes. Many regions present unique opportunities, such as the ability to drill the seismogenic zone, extremely active volcanic arcs, seismic gaps with centuries of strain accumulation, and likely tsunami earthquakes, that provide a natural potential to capture key phenomena. Moreover, many subduction processes have natural cycles on the scale of decades or centuries and the only way we will piece together a complete understanding of the whole cycle is to piece together what we can learn from different regions that are currently at different stages of that cycle.

Workshop participants recognized that a variety of programatic approaches will advance subduction zone science, that many styles have been successful in the past, and different aspects could be phased in over time. Three key components were identified:

  • A Community Modeling Collaboratory,
  • An Interdisciplinary Science Program, and
  • A Large Scale Infrastructure Program.

This combination over a 10-year effort could reveal new phenomena, integrate data with models, and lead to hazard forecasting that is informed by fundamental tectonic, physical, and chemical drivers. A diverse committee of scientists is currently writing up a detailed report on the priorities and strategies identified during the meeting. The report is on target to be put up for comment in late 2016 and finalized in early 2017. ■

Reference information
The Subduction Zone Observatory Workshop . J. McGuire, T. Plank

GeoPRISMS Newsletter, Issue No. 37, Fall 2016. Retrieved from http://geoprisms.nineplanetsllc.com

HOBITSS Hikurangi Ocean Bottom Investigation of Tremor and Slow Slip


Erin K. Todd (University of California Santa Cruz) on behalf of the HOBITSS experiment team

The Hikurangi Ocean Bottom Investigation of Tremor and Slow Slip (HOBITSS) experiment is a multi-national collaborative offshore seismic and geodetic research project that explores the relationship between slow slip events (SSEs), tectonic tremor, and seismicity along the shallowest part of the northern Hikurangi Margin where the Pacific Plate is subducting beneath the North Island of New Zealand. An array of 24 absolute pressure gauges (APG), fifteen ocean bottom seismometers (OBS), and three ocean bottom electromagnetometers were deployed between the shoreline and the trench for thirteen months to capture deformation, seismicity, and conductivity changes during large SSEs offshore the North Island’s east coast.

This offshore Gisborne region hosts shallow SSEs (<15 km depth) approximately every eighteen months that typically last from one to three weeks and release energy equivalent to Mw 6.5-6.8 earthquakes. However, to capture vertical deformation with the seafloor pressure sensors, the network needed to be in place during one of the larger SSEs, which only occur every four to six years. With the last very large SSE in the Gisborne region in March/April 2010, choosing the correct time for the deployment was definitely a gamble, as the timing of the large north Hikurangi SSEs is not particularly predictable! Thankfully, the anticipated SSE began in late September 2014 directly beneath the HOBITSS array (Fig. 1). The September 2014 SSE was the second-largest SSE observed on that part of the subduction zone, so we were incredibly lucky to have the seafloor instruments in place at just the right time.

Between the deployment and recovery expeditions, the science party consisted of researchers from the United States, Japan, and New Zealand, marine geophysical instrument engineers from the United States and Japan, and ten graduate students from the United States, Japan, and New Zealand. The experiment was funded by NSF Marine Geology and Geophysics in addition to Japanese and New Zealand funding agencies. These expeditions were the first seagoing experience for many of the graduate students, myself included.

May 2014 – The Deployment

New Zealand’s Research Vessel Tangaroa was used for the deployment cruise. We set out from Wellington and began the 24-hour journey to our deployment site. Those 24 hours were very busy as the engineers began checking over every component of the instruments to ensure they were ready for deployment. As a graduate student on my first scientific cruise, I spent the first day learning my way around the ship, adjusting to ship life, and meeting all the members of the science and engineering parties. While a couple of the grad students had been on scientific cruises before, the rest of us had never been to sea before and didn’t know what would be expected of us or how we would fit in to the deployment procedure. Thankfully, everyone in the science and engineering parties was extremely helpful and, by the time we reached the deployment site, we all knew what to do.

Once the deployment began, the mood on the ship changed. Everyone was focused on the task at hand. The first day of deployment was a whirlwind as we deployed fourteen instruments and recovered four that had been deployed the previous year as part of another experiment. Each step in the deployment procedure was well executed and it was fascinating to watch the exchanges between the leaders of the science party and the engineers as they worked together to determine which instrument would be ready for deployment next, how long it would take to transit to the deployment location, and how long it would take to survey the deployed instruments to pinpoint their final location (Fig. 2). So many moving pieces and steps needed to be completed in the correct order to successfully deploy the instruments with the time and resources available. Prior to the cruise, I had assumed that certain elements of the experiment like the order of station deployment had been pre-determined. I was surprised at the number of decisions that had to be made at the time of deployment based on the immediate resources and weather conditions. Once I was on the ship, I realized how quickly something could happen to change any pre-determined plans.

We were fortunate enough to have good weather for the first few days, but by day 4, the weather took a turn for the worse. Three days into the cruise, we had deployed 24 stations and seemed to be ahead of schedule, but our good fortune came to a swift end when a storm arrived early on the fourth day forcing us to hold position through the storm for 36 hours. With strong winds and heavy swells, deploying new instruments and surveying the locations of previously deployed instruments was out of the question. While some of the grad students had been to sea before, others of us had not and discovered if we were prone to seasickness or not. I was lucky enough to not get seasick, but for others, the storm brought some real challenges. Fortunately, everyone helped each other out to ensure that all essential tasks were covered. Calm weather returned for the last few days of the cruise and we were finally able to deploy the remaining instruments before turning back for Wellington Harbor.


“I learned that if you are going to take sea-sickness medication, it should be well before the research vessel leaves the dock. Preventative measures are key. I learned a lot on the HOBITSS deployment cruise, especially what goes into determining simple parameters that data analysts and grad students like myself take for granted, for instance, the latitude, longitude, and depth of the instrument. Ocean bottom instrument deployment can be more complicated than land deployment, and it was enlightening to see the Principal Investigators work to figure out the next deployment site and manage the experiment. It was good experience to help with the cruise report and determine locations of instruments, as well as learn how to ping the instruments as they sunk to the ocean floor. My advisor arranged a series of science talks on the deployment, so I learned a lot about the context of the experiment, which is really helpful because I will be working with the data. I appreciated the opportunity to meet and work with a variety of scientists from Lamont-Doherty Earth Observatory, the Earthquake Research Institute in Tokyo, Japan, Tohoku University, University of Texas Austin, University of California Santa Cruz, and New Zealand. We had a very international team!”

– Jenny Nakai, Graduate Student, University of Colorado Boulder


“The HOBBITS cruise was quite an unique experience for me. Unlike previous cruises I participated to learn and observe as a student, on the HOBBITS deployment cruise I worked as part of the OBS technical team. My main responsibility was to assemble and service ocean bottom seismometers and pressure gauges to get them ready for a yearlong deployment.
Working together with the OBS team on the deck on a nut and bolt level make me realize the amount of work and level of dedication that goes into deploying each OBS. For example, in order to make sure that the instrument can return to the surface following an acoustic command, two redundant release systems are put in place, both equipped with two sets of redundant wiring. Only one of the four needs to work properly for the system to function, but all four systems need to be quadruple-checked before deployment. Given the harsh environment at the sea floor, we can’t take any chances.”

– Yang Zha, former Graduate Student, LDEO, Columbia University


June 2015 – The Recovery

From the perspective of those of us who had never been on an OBS recovery cruise, the idea of successfully recovering 35 instruments that had been sitting on the ocean floor for thirteen months, accumulating sediment and marine life, seemed daunting. We knew the main Gisborne slow slip event under the array had occurred four months into the deployment and a second slow slip event had been recorded to the south of the array, so there was a lot of anticipation and the Principal Investigators were very eager to get a look at the data.

The United States’ Research Vessel Roger Revelle was used for the instrument recovery cruise. This time, the expedition began and ended in Napier, which is a famous “Art Deco” city on the New Zealand’s east coast. Most of Napier was destroyed in an earthquake in 1931 and was completely rebuilt right after that in the Art Deco style of the time. Napier is very close to the HOBITSS experiment location, so the transit to retrieve our instruments was shorter than for the deployment.

There was a lot of nervous excitement among the team as we arrived on site and prepared to recover the first instrument. What if the instrument was buried by sediment? What if the receiver on the instrument didn’t recognize the release command? What if marine life or sediment had damaged the instrument in some way and it didn’t float back to the surface? What if the battery died during the deployment? What if the pressure case leaked and the instruments were exposed to seawater? The seafloor is a harsh environment for sensitive electronics and there were many things that could have gone wrong.

After the first instrument was brought on board, the tense mood that had gripped the team relaxed and we started to recover instruments in earnest. The seas were calm and the winds were light for the first full day of recovery and nine instruments were recovered. Recovering instruments is a tricky process – even if everything works and the instrument rises to the surface, there are still challenges to getting it on board. As the ship arrives on site, we use the ship’s hull-mounted transducer to communicate with the instrument and send the correct signal for the instrument to release its weights and start rising toward the surface. Depending on the ocean depth, the ascent can take over an hour. During that hour, the ship and instrument communicate back and forth to track the progress of the ascent. Once it is clear that the instrument has reached the surface, we would send out spotters all over the ship to look for the instrument bobbing on the surface. Some of the instruments have small flags attached because when they rise off the ocean floor they would float just below the surface and it would be difficult to locate them without the small pennant flag. As the instrument is spotted, the captain would maneuver the ship alongside it. The technicians and engineers would then use long poles equipped with hooks on the end to grab the instrument and hook it up to the winch to pull it out of the water. Each step requires numerous people doing their part carefully and at exactly the right time.

We were keeping an eye on a storm that was heading our way, threatening to reach us in the middle of the cruise, so we worked quickly to recover as many instruments as possible before the seas got too rough. As the storm hit, we were forced to suspend recovery operations due to high winds and large swells. On one of my shifts, we hit a particularly large swell and everything that wasn’t strapped down went sailing across the room. Chairs toppled over, notebooks and papers went sliding, and a large telephone fell of the table. Thankfully, after one or two stormy days, we were able to resume operations and recover the rest of the instruments. We successfully recovered 34 of 35 instruments: after many attempts over a few days, one of the ocean bottom electromagnetometers was considered lost after it never acknowledged the communication from the ship.

Most of our instruments were deep water (over a thousand meter depth), but five of them were on the shelf, less than one hundred meters water depth. One of the complications with having instruments at such shallow depths is that they quickly accumulate a lot of marine life (Fig. 3). In order to pass the agricultural inspection once back to port, all the instruments had to be thoroughly cleaned of any traces of mud, plant life, or animal life.

Cleaning these instruments became a large part of the graduate students’ jobs during the second half of the cruise. Soft- and hard-bodied organisms, coating every inch of the instruments, had to be removed. The task was messy and smelly but very critical, as we would not have been allowed to re-enter New Zealand with dirty instruments. As we arrived back in to port and the agricultural inspector came on board to check the instruments, they found a small patch of mud about the size of your palm deep in the inside of one of the instruments that had to be cleaned with alcohol and paper towels and placed into a quarantine bag. After cleaning the remaining mud off the instrument, we were given the all clear!

Hard won results

All the hard work to deploy and recover the instruments really paid off in the end! The Absolute Pressure Gauge data showed that the SSE in September 2014 produced a clearly observed 2-7 cm of vertical deformation of the seafloor (Wallace et al., 2016), much more than any of us ever expected. The vertical deformation shows that slow slip occurred to within at least 2 km of the seafloor, and it is possible that slip went all the way to the trench (Fig. 1). The HOBITSS results really help to demonstrate that Absolute Pressure Gauges are a valuable tool for monitoring centimeter-level offshore tectonic deformation. In addition, preliminary results from the seismic data show the existence of tectonic tremor during the slow slip and that the previously observed seismicity increase during the last large Gisborne SSE in 2010 is also present for the 2014 SSE in similar locations (Todd et al. in prep).

Future Projects – 2017 & 2018

In addition to the HOBITSS experiment, there are a number of exciting future projects slated for the Hikurangi subduction margin in the coming years. The shallow nature of these slow slip events will be the target of IODP drilling in 2017 and 2018 (Expeditions 372 and 375), to better understand the physical origins of slow slip and to install borehole observatories to do near-field monitoring. In addition to the drilling experiment, the R/V Marcus Langseth will undertake an NSF-funded 3D seismic survey in early 2018 to image the shallow slow slip source area. Being able to tie the HOBITSS experiment results in with the results of co-located IODP drilling and 3D seismic imaging will be very exciting! ■

“Report from the Field” was designed to inform the community of real-time, exciting GeoPRISMS -related research. Through this report, the authors expose the excitement, trials, and opportunities to conduct fieldwork, as well as the challenges they may have experienced by deploying research activities in unique geological settings. If you would like to contribute to this series and share your experience on the field, please contact the GeoPRISMS Office at info@geoprisms.nineplanetsllc.com. This opportunity is open to anyone engaged in GeoPRISMS research, from senior researchers to undergraduate students.
We hope to hear from you!

Reference information
HOBITSS – Hikurangi Ocean Bottom Investigation of Tremor and Slow Slip. E.K. Todd
GeoPRISMS Newsletter, Issue No. 37, Fall 2016. Retrieved from http://geoprisms.nineplanetsllc.com

E-FIRE Field Institute Alps Summer 2017 | Monviso


Monviso

 icon-location-arrow 44.666˚N 7.110˚E

The Monviso Ophiolite is made up of two intact sections of Tethyan oceanic crust that both reached eclogite facies conditions during subduction and collision of the European margin beneath the African plate. Peak metamorphic conditions of of 2.2-2.6 GPa and 480-550 °C were reached at ~50Ma. Both ophiolite sections are comprised of metasedimentary cover, metabasalt, metagabbro and serpentinized peridotite with varying amounts of deformation and retrogression (particularly in the metabasalts). The lower section is cut by several shear zones which contain blocks of the various lithologies in a serpentinite matrix and show evidence of pervasive fluid rock interaction.

E-FIRE research on this field location aims to understand the duration and distribution of fluid-rock interaction and the sources of these fluids, the age of important metamorphic events, and the preservation of ocean-floor isotopic stratigraphy to eclogite facies. Samples collected include undeformed and unaltered examples of the entire lithologic stratigraphy of the lower ophiolite section, various examples of fluid-rock interaction (veins and detailed transects of metasomatic rinds), rodingites, calcite-bearing metasediments, and examples of exceptional mineral textures (mylonitized to extremely coarse-grained eclogite, static to mylonitized serpentinite).

Sample Photos

Field Photos


Seeking the origins of continents in the western Aleutian island arc


Elizabeth Cottrell (Smithsonian Institution), Katherine A. Kelley (University of Rhode Island), Michelle Coombs (USGS Alaska Volcano Observatory), Elizabeth Grant (University of Washington), Mattia Pistone (Smithsonian Institution), and Katherine Sheppard (UC Santa Barbara)

The origin of Earth’s continents is among the most fundamental of questions facing geoscientists today. Though andesitic in composition, continental crust shares many geochemical characteristics with basaltic lavas erupted at subduction zone arc volcanoes, suggesting that subduction zone magmatism somehow manufactures Earth’s continents. Our project goal is to examine one particular attribute shared by arc magmas and continents, unusually low iron contents (sometimes referred to as “calc-alkaline affinity”). Our work will test the roles of magmatic water content, oxygen availability, and parent magma composition on the development of low iron in arc magmas. With this goal in mind, we conducted a three-week field campaign, from September 4-23, to the far Western Aleutian islands of Buldir, Kiska, Segula, Little Sitkin, Semisopochnoi, Gareloi, Tanaga, and Kanaga, home to some of the most calcalkaline lavas on Earth. The goals of the field program were to collect samples of volcanic airfall deposits (tephra), which may preserve glass inclusions within the igneous phenocrysts that will reveal the water contents and oxygenation conditions of these end-member magmas. We conducted our field work from the home base of the R/V Maritime Maid, which anchored in four harbors among these islands, and used a Bell 407 helicopter to access field sites on these eight volcanoes. On the Maid, our GeoPRISMS team of five (Liz Cottrell, Michelle Coombs, Mattia Pistone, Elizabeth Grant, and Katherine Sheppard) was joined by a team of volcanic gas scientists supported by the Deep Carbon Observatory (Tobias Fischer and Taryn Lopez) and a team of geophysicists and field technicians from the Alaska Volcano Observatory (John Lyons, Dane Ketner, and Adrian Bender) who serviced the USGS seismic network on several of these volcanoes for the first time in more than ten years. Project PI Katie Kelley could not be in the field, but participated remotely via satellite phone and internet tools that allowed her to track the ship, helicopter, and us in nearreal time. Our voyage is a great example of how multiple teams can work together to achieve great things.


– Liz Cottrell

Preparing for Danger: Training in Anchorage

2 September 2015 | Anchorage, AK • We’re here. Anchorage, Alaska. Months of planning and training are behind us. In three days we will take a three hour jet flight to the airstrip that is both farthest East and farthest West in the United States (figure out that riddle!). From there, we will board a small boat, The R/V Maritime Maid, and steam West into the uninhabited islands of the Western Aleutians. We will only have what is in our suitcases and what we shipped months ago – and I am scared. I am scared I didn’t prepare my team. I am scared I don’t have the right equipment. I am scared I will make poor decisions. But I am most scared of this pool I’m in. This is the Learn to Return Aviation Land and Water Survival School, more commonly known as “dunker” training, with the unfortunate slogan “Be the One to Come Home!” And I’m thinking “Can’t we all come home?” In this course, we get strapped into metal seats with five-point
harnesses meant to mimic the fuselage of a plane or helicopter. We hover above the water. My instructor, Clint, barks, “Mayday Mayday! This is Echo Alpha Romeo 289 with two souls on board. We are ditching! Ditching! Ditching!” And then WHAM! The seats flip and I impact the water. I can’t see. I can’t breathe. I follow the routine. (0) Don’t panic. (1) Slide my hand. Find the door latch. (2) Open the door. (3) Anchor my hand in the door frame. (4) Slide my other hand to unfasten my belt and pull myself out. Even now, dry, thinking of Clint’s voice sends chills down my spine. One team member doesn’t pass the course. I think of my two kids and wonder if I should just get on a plane home. But somehow, tomorrow I board my flight to Adak. The R/V Maritime Maid and “2-Mike-Hotel” (the Helicopter)

3 September 2015 | Adak, AK • The heli pad on the Maid looks to be about the size of my desk at work. I wonder how it is that my first ever helicopter experience will be taking off from the back of a boat and going over the Bearing Sea to the rim of a volcano. Am I crazy? Our pilot, Dan Leary, is the most experienced pilot at Maritime Helicopters and the absolute best pilot I could ever have hoped for. I soon understand that Captain George Rains, who has sailed these waters for longer than I’ve been alive, isn’t going to take any unnecessary risks.

Weather Orphans the Helicopter

5 September 2015 | Constantine Harbor, Amchitka, AK • The Maritime Maid left port in Adak yesterday destined for harbor in Amchitka. At the time of our departure, the weather was beautiful with sunny, blue skies and a clear view of a steaming white fumarole at the summit of Kiska. The Maid does not sail with the helicopter parked on the deck. Instead, the helicopter normally flies when the boat is underway and they meet up again in harbor. Our plan yesterday was for the helicopter to meet us when we moored in Constantine Harbor, Amchitka but, as we sailed, fog closed in at Adak and kept the helicopter from following us. We have no scientific interest in Amchitka, so we must wait for the helicopter to join us.

8 September 2015 | Kiska Harbor, Kiska, AK • After four days of separation, we are finally reunited with the helicopter! Two days ago, we decided to lift anchor and head to Kiska harbor in the hopes of starting work, with or without the helicopter, and left a fuel cache on Amchitka so the heli could catch up with us as soon as weather permitted. We made the most of our idle time at Amchitka by taking a small skiff to shore, doing a gear shakedown, and taking some “practice” samples. Likewise at Kiska, we were able to skiff to shore yesterday and explore the area around the harbor, view and sample some distal volcanic deposits, and try not to set of any unexploded ordinances leftover from World War II. Kiska was a WWII battleground, occupied by the Japanese for a time before being re-taken by the US, and the historical remnants litter the ground and harbor.

9 September 2015 | Segula Volcano • My first day of real field work! Because of the remoteness of this region, few geological studies have been done here. Today’s target, Segula, hasn’t been visited by geologists since the 1940’s and there are only three known rock analyses from this volcano. We find a gorgeous exposed tephra section in a wide gully and greedily fill our bags with this “black gold.” By the end of the day, I realize with satisfaction that our work will return precious samples from this volcano ripe for new discoveries. – Liz Cottrell


– Elizabeth Grant

Minefield Kiska

9 September, 2015 | Kiska Island • Team tephra is in search of olivine in mafic tephra and we have split up into two sub-teams today so we can cover more ground. Mattia and I are on Kiska, the third westernmost island in the Aleutian chain. The helicopter drops us off on a relatively flat, topographic low near the northern flank of Kiska Volcano, next to a recent lava flow. As the helicopter flies off to assist the other teams, Mattia and I survey the landscape and geologic map to get our bearings. We quickly realize that what we had assumed to be a relatively easy passing is actually a literal and figurative minefield. Instead of consisting of relatively young olivine-rich basalt, the flow is actually composed of older blocks of andesite, twice as wide as we are tall and covered with plants and grasses that reach up to our waists. Not only that, but Kiska is littered with “UXO,” unidentified explosive ordinances, which could be anywhere. From our topographic low, it takes us 45 minutes to scramble the 40 meters to the top of the lava flow, and we arrive at the top sweating and out of breath. As we survey our progress, it dawns on us that we will not be able to cross the rest of this flow; it’s too large and too dangerous. From the comfort of the ship’s galley, we had routed our path across the map’s page, talking about sampling along the way. In reality, the unexpected size of the lava flow provided us with some much-needed perspective about the unforgiving scale of nature and the long-reaching consequences of human activity.


– Katie Kelley

The Virtual Aleutians

10 September 2015 | Narragansett, RI • I wish I were there. And I don’t. Staring at the computer screen, I wonder for the umpteenth time if I made the right decision to stay home. My baby daughter, Miranda, is only four months old, so I couldn’t have gone. Still, I can’t help but have this internal debate daily. It is mid-afternoon here and they will be starting their day in the field soon. I login to a website to check the location of the Maid and the helicopter, both of which pop up on an animated map of our field area. When the helicopter is in flight, it lights up pink and its little propeller turns as it moves across the screen. Watching this is the most exciting part of my shore-based experience.

My phone rings and the caller ID shows “Liz Sat Phone.” Liz says it is raining and I can hear the raindrops over the phone. It seems always to be raining there; she says the volcanoes make their own weather. We quickly debrief on yesterday’s work and go over a plan for the coming day’s activities: our party will deploy one team to Kiska, and the other to Buldir. Buldir is the riskiest flight of the trip, partly because the flight itself is extremely dangerous and partly because they might not find anything useful when they get there, so they are risking life and limb possibly for naught. I am incredibly nervous for them. After we hang up, I login to another website to track Liz’s InReach device, which sends her location every ten minutes. I leave the office just as the helicopter leaves the Maid for Buldir.

Of course, Liz tried to contact me from Buldir while I picked up my children from day care, during the only ten-minute window of my day when I had to pocket my phone. They made it safely there, which is a relief, and I briefly text with Liz’s husband, who is also closely tracking her steps, about how wild it is to watch her walking around. When I get home, we setup my laptop at the dinner table (the only time a computer has ever been allowed at the table, mind you) so my whole family can watch the “action” as it happens. My three year-old daughter has learned the names of all of the volcanoes on the itinerary and asks where Liz and the helicopter are today.


– Mattia Pistone

Kiska Volcano: Ascensus ad coelum et descensus ad Inferos

10 September 2015 • Thirty minutes prior to sunrise. From the vessel bow, while sipping hot tea, I observe that low-elevation clouds still seal the sky. These are not ideal conditions for helicopter flight but this is our last day on Kiska Island and, despite numerous attempts on the flanks, we have yet to find any of the rocks (mafic tephra) that we are looking for. We can only hope to find a fissure in the cloud barrier and find a way to the volcano summit. The wind is with us, however, and it is rapidly clearing up the sky from the dusty clouds. Today, the first team to be deployed by helicopter is the gas team (Tobias Fischer, Taryn Lopez) supported by Adrian Bender, the sedimentologist of “tsunamites” and “stormites,” who is going to be the “radio antenna man” in contact with the Maid while the group collects dangerous volcanic gases on the southwest flank of the volcano summit. The helicopter is fully packed with people, backpacks, and field instruments. There is only one free seat for one person with a backpack. After briefing with the other members of team tephra, it is unanimously decided that I will join the gas team today. I will be tasked with finding and returning rocks from the volcano summit back to the research vessel. I am thrilled! After taking off, our helicopter pilot Dan Leary is like a hawk looking for prey; he finds a spot with broken clouds and steers into it. Thanks to the ascending winds increasing while approaching the hidden east flank of the volcano, we are promptly above the clouds – the sky can also be blue here in the Aleutians. While ascending, the northwest wind is too strong to make any attempt for landing at the volcano summit. Therefore, we are all deployed at about a thousand feet below the volcano summit. It looks like we will have to reach the summit only with some effort and sweat. After a short briefing about work tasks and timetable, and radio communications, the gas team and myself initiate our hike up. Lava flows, loose volcanic bombs and blocks dominate the landscape. After several days at low elevation, I can enjoy this hike without fear of encountering UXO. I am at the top of the crater rim and the landscape in front of me is gorgeous! The volcano crater is in front of me and I feel so small and insignificant. Clusters of loose rocks cover the internal flanks of the volcano. The crater floor is filled with fine volcanic material; it looks like mud. The western side of the volcano has no rim and from there, low-elevation clouds ascend and enter this amphitheater while the northwestern winds blows. I am the lonely spectator of this volcanic show and feel like an explorer – I am the first one to set foot in this volcanic crater… well, after the geologist Robert Coats, who most probably came here during his mapping work in the early 50’s… but, for sure, I am the first Italian here! That’s exciting! Now, back to work. I report the GPS coordinates and field
observations in my book and start to hammer the samples I need. Any sample I take looks beautiful and full of precious information. I wish to take any and all specimens with me since this is the first and last chance we have to collect rocks in the crater of Kiska Volcano during this field mission. But I have to face the reality: I am by myself and cannot carry too many rocks. How time flies! I am quick to collect samples, observations, and data because I have to go back soon. We have now 70 kg of rocks to hike to our helicopter rendez-vous location and I anticipate a very negative reaction from the gas team, who have worked hard for many hours. Instead, I receive generous support, which is typical of an enthusiastic team of people. This is the best reward after a long day of work between volcanic rocks and wind gusts. Together, we march back to the pick-up point. I think this is the greatest day of the field mission here in the Aleutians.


– Katherine Sheppard

On the Edge

10 September 2015 | Kiska Harbor, Kiska, AK • Buldir is a tiny speck of an island about halfway between the much larger masses of Kiska and Attu, all the way out in the far Western reaches of the Aleutian chain. How far out? Let’s just say we didn’t have our passports with us, so we couldn’t except to legally get much further west. There are 45 miles of open water to the east and west of Buldir, which was about a 45-minute flight for our Bell 407 helicopter. This is a perfect amount of time to reminisce about three things: we would be among only a few geologists to visit the volcano in decades, we only had one day to do as much work there as we possibly could, and if anything went wrong while on the island we were all royally screwed. Our day on Buldir had the potential to be the most dangerous day of the trip, mostly due to the long over-water helicopter flight and the remote location. If the helicopter landed but couldn’t take off due to bad weather,
we would be stuck out there until the weather cleared or the boat came to get us. As anyone familiar with the weather in the Aleutians knows, this could take a very, very long time.

As it turned out, we landed, did our work and I soaked in the glory of feeling like a real life explorer. The fog stayed at a respectful distance, the wind stayed manageable, and we were able to take off at the end of the day with minimal excitement. When we landed on the boat 45 minutes later, however, we were ecstatic. We had found amazing tephra samples that suggested an explosive, volatile-rich history for Buldir. Not at all as we were led to expect before the trip, so a resounding success! Only when we had unpacked all the rocks and rid ourselves of our protective gear did our helicopter pilot turn to Liz, let out a breath he seemed to have been holding all day, and say “I am never, ever, ever doing that again.”


– Liz Cottrell

12 September 2015 | Semisopochnoi • With the stressful overwater flight to Buldir behind me, I find myself relaxed and enjoying the flight to Semisopochnoi Volcano. A survey from the air reveals beautiful sections of tephra cut from the vegetated landscape. Michelle and I are able to sample meticulously here all day.

17 September 2015 | Gareloi • I am standing waist-deep in olivine scoria and loving it. Katherine and I fill our sampling bags to bursting and I know we have gotten what we came for. I then hike up to the crater rim – just to take a peek. I am stunned at what I see… a crater lake and active fumaroles! This appears to be a new development since the last time geologists visited this place in 2005 and I am reminded that these are indeed very active volcanoes.


– Michelle Coomb

20 September 2015 | Kanaga • Gas team and two tephra teams got set on Kanaga in the morning, and then boat transited from Hot Springs Bay on Tanaga to the Bay of Islands on the west side of Adak. This was the most spectacular day of the trip so far. Kanaga was completely out and cloud free and I took many beautiful photos. Kanaga is a great island and volcano – deep blue lake in the caldera, spectacular lava flows, deep green grass everywhere. Kanaton Ridge is just screaming out for more and better work, as is the entire island. Visited a few tephra sections as guided by CW’s paper and found some big lapilli pumice falls. No mafic scoria to speak of, unlike Tanaga, and much to our team’s disappointment. I think I found two mafic ashes that may be from Tanaga, which will be interesting to see. We ended the day around 5 pm at the hot springs.■


“Report from the Field” was designed to inform the community of real-time, exciting GeoPRISMS -related research. Through this report, the authors expose the excitement, trials, and opportunities to conduct fieldwork, as well as the challenges they may have experienced by deploying research activities in unique geological settings. If you would like to contribute to this series and share your experience on the field, please contact the GeoPRISMS Office at info@geoprisms.nineplanetsllc.com. This opportunity is open to anyone engaged in GeoPRISMS research, from senior researchers to undergraduate students.
We hope to hear from you!

Reference information
Seeking the origins of continents in the western Aleutian island arc
GeoPRISMS Newsletter, Issue No. 36, Spring 2016. Retrieved from http://geoprisms.nineplanetsllc.com

Investigating older rocks in the oceanic Aleutian volcanic arc east of Adak


Peter Kelemen (Columbia University, LDEO) on behalf of Merry Yue Cai (Columbia University, LDEO), Emily H.G. Cooperdock (UT Austin), Steve Goldstein (Columbia University, LDEO), Matt Rioux (UC Santa Barbara), and Gene Yogodzinski (University of South Carolina)

Benefiting from the NSF GeoPRISMS community platform in the Aleutian volcanic arc in the summer of 2015, our group from the University of South Carolina and Columbia University had a
matchless opportunity to study and sample outcrops of pre-Holocene volcanic and plutonic rocks on Unalaska, Umnak, and Atka Islands. Speaking for myself, at the age of 59 and having worked in the field in a lot of spectacular places – every year for forty years – this was one of the most memorable and rewarding field seasons of my life.

The older rocks in the Aleutian volcanic arc are notable because they include the most extensive outcrops of plutonic rocks in any oceanic arc, worldwide. Aside from the visionary work of Sue and Bob Kay and their colleagues, these plutonic rocks have not received much attention since pioneering USGS studies were completed in the 1950’s (Umnak), 1960’s (Unalaska), and 1970’s (Atka). This prior work demonstrated that the Eocene to Miocene plutonic rocks east of Adak Island were more strongly “calc-alkaline”, with higher SiO2 at a given Mg/Fe ratio, compared to the “tholeiitic”, Holocene volcanic rocks on the same islands.

In a recently published pilot study using USGS samples (Cai et al., Earth Planet. Sci. Lett. 2015), we found that these plutonic rocks are also isotopically distinct from the lavas on the same islands, demonstrating that the two suites were generated by melting of two distinct sources.

Our field season in the summer of 2015 was designed to investigate whether these differences in source composition were the result of :

  1. temporal evolution of the arc, in which case Miocene to Eocene lavas should have isotope ratios similar to those of calc-alkaline plutons, and perhaps will also mirror the calc-alkaline compositions of these plutons, or
  2. distinct processes, in which viscous, SiO2– and H2O-rich, calc-alkaline, andesitic magmas tended to stall and form mid-crustal plutons, while relatively low viscosity, SiO2– and H2O-poor, tholeiitic, basaltic magmas tended to erupt on the surface, in which case Miocene to Eocene lavas may be isotopically (and compositionally?) distinct from coeval plutons.

To this end, we hoped to sample coeval plutonic and volcanic arcs on several Aleutian islands where the plutons are well-exposed.

Our starting plan was to set up fly camps in the alpine terrain on the islands, which is underlain by extensive outcrops of granodiorite and diorite plutons. We assumed that we would have difficulty obtaining ages on highly altered volcanic rocks, whereas it would be relatively easy to date zircons from the large plutons. Thus, we expected to sample volcanic rocks where they are intruded by plutons of known age. Frankly, my expectations about the field work were not high. I imagined we would be semi-lost in perennial fog, while disconsolately scraping moss, lichen, and tundra grasses off texture-less, fine-grained, grey-green outcrops, and spending a lot of time arguing about whether a specific sample was volcanic, plutonic, or even sedimentary!

Merry Cai, Steve Goldstein, Gene Yogodzinski, and I flew to the commercial airport in Dutch Harbor on Unalaska Island on August 5, where we were joined by pilot Sean Charlton in Pollux Aviation’s R44 helicopter. Sean had flown out from the mainland, with floats fully inflated. I had never used such a small, gasoline-powered helicopter, with an engine not much larger than a lawnmower, so I was a bit skeptical at first. We initially focused on the Shaler pluton on Unalaska, which is the largest in the Aleutians, and hence in any oceanic volcanic arc, worldwide. The weather was quite good when we were there, which allowed us to fly every day. Everyone says the Aleutian weather is bad and unpredictable, and of course, it is, but not always. Working there can often be quite nice. We set up a couple of fly camps, and ranged through the beautiful alpine terrain, examining complex border facies of granodiorite, diorite and volcanic hornfels. We also took advantage of the helicopter on re-supply days to make ground stops along the coast. There, we found exceptional outcrops, including surprisingly fresh volcanic rocks with chilled margins, suitable for 40Ar/39Ar geochronology.

After a while, the exceptional coastal exposures, coupled with the convenience of the helicopter, induced a change in our plans. We moved into the hotel in Dutch Harbor, and flew every day. It
turned out that world-class sea cliff outcrops, coupled with wave cut terraces that offered ideal helicopter landing sites at all but the highest tides, provided a spectacular opportunity for us to conduct comprehensive sampling.

As the photos accompanying this article show, the Aleutian sea cliffs revealed spectacular sequences of pillow lavas, pyroclastic deposits, and columnar-jointed sills. Indeed, photos in the USGS Bulletins showed some of these exceptionally well-exposed features, but in earlier years, without a helicopter, these outcrops were very difficult to access from small boats. In addition, there were few opportunities to obtain reliable ages on the lavas. With the helicopter, and some confidence about 40Ar/39Ar dating of fine-grained volcanic rocks, we were in heaven. Further, as it turns out, our samples from the many sills intruding the volcanics will provide plenty of opportunities to check the Argon ages using U/Pb in zircon.

As it turned out, the R44 helicopter was perfect for us, fitting easily into small landing spots, often within ten meters of the Pacific surf. Unfortunately, Steve Goldstein came down with shingles and had to convalesce in Dutch Harbor, sampling volcanic rocks from the extensive road network when he could. However – sorry Steve! – this did reduce our helicopter-supported group to three, who just fit into the three passenger seats in the R44, enabling ultra-efficient field work. We would leapfrog along the coast, setting out one or two people at each landing spot, and scheduling pickups a few hundred meters further along the coast.

In the middle of August, we moved from Unalaska to Umnak Island, where we were fortunate to stay in a bunkhouse at Bering Pacific Ranches, Ltd., near the abandoned WWII airfield at Fort Glenn. This is a fascinating operation; while we were there, Ranch owner Pat Harvie and his crew were preparing to round up thousands of “organic, free-range” cattle from across the island, using a fleet of R22 helicopters, plus a lot of bailing wire and duct tape. These animals were destined for shipment to Canadian markets in the late summer and early fall. We all hope this visionary operation ended in great success!

From this spectacular basecamp, we spent several productive days sampling along the north and southeast coasts of the island, with a side-trip to the rim of the giant Okmok caldera during a clear spell. We also used the opportunity to access the westernmost peninsula of Unalaska Island, completing our extensive sampling there. All too soon, it was time to leave the Ranch. We returned to Dutch Harbor, where we met Captain George Rains, the crew of the R/V Maritime Maid, and pilot Dan Leary with Maritime Helicopters’ Bell 206 Long Ranger. We also rejoined a rejuvenated Steve Goldstein, together with his daughter, Emily Cooperdock, who had flown up to join us. This increase in our group size corresponded with the change from the four-seat R44 to the six-seat 206, and as a result we remained a highly efficient, helicopter-supported team!

We moved into comfortable quarters onboard the Maid and, delayed by weather, spent a few more days living on the ship in Dutch Harbor, continuing to sample on Unalaska Island. Until this point, we had not lost a single day to weather, though we had gotten wet on a couple of days.

However, our transit to Atka Island, and our work there, were substantially delayed by wind, then fog. A side benefit was a spectacular morning at anchor among the Islands of Four Mountains,
where we photographed the perfect strato-volcanoes there while we waited for the helicopter to catch up with the ship. Finally, the weather cleared and we spent a highly productive day and a half
racing along the western peninsula of Atka Island, acquiring a fantastic set of samples, including previously dated intrusions that span the range from the youngest (9 Ma) to oldest (39 Ma) plutons known in the arc east of Adak.

We then set out for Adak Island. In the airport there, we greeted the next group who would use the GeoPRISMS community platform onboard the Maid, led by Liz Cottrell. We wished them all the best and, sadly, began the long trip home.

In addition to the pilots, and the crew of the Maritime Maid, we would like to express deep gratitude to Program Manager Jenn Wade at NSF, who worked tirelessly to make the community platform concept come alive, and to Christie Haupert, Alaska Science Project Manager for Polar Field Services, Inc., who provided flawless logistical support.

Preliminary data on a few 2015 samples, Unalaska Island.

PS: Since that time, we’ve been working hard processing our samples and obtaining initial data. On the left is a plot of some early, major element analyses of our samples from Unalaska Island. Note that, as for the USGS samples we analyzed for our pilot study (Cai et al., Earth Planet. Sci. Lett., 2015), most of our 2015 plutonic samples are calc-alkaline and most of our 2015 mafic lava samples are tholeiitic, despite the fact that the 2015 lavas and plutons are approximately coeval. This suggests that the chemical differences documented by Cai et al. (2015) are present among coeval igneous rock suites in the Aleutians, and did not arise as a result of temporal evolution of both volcanic and plutonic magmatism.

In addition to our main line of inquiry, outlined above, we are evaluating the potential for study of detrital zircons in volcanoclastic sediments, while Emily Cooperdock is preparing a proposal to study the uplift and denudation history of the Aleutians via U-Th-He thermochronology as well as fission track and 40Ar/39Ar analyses. ■

A) Schematic map of the Aleutian island arc, sampled areas are highlighted in black. B) Wt% SiO2 versus Fe/Mg ratio of studied Aleutian igneous rocks. By convention, the Fe/Mg ratio is calculated using wt% MgO and FeO, with all Fe as FeO. C) Present-day Nd and Pb isotope ratios of Aleutian igneous rocks vs. longitude and vs. age. Circles are central and eastern Aleutian volcanics: Yellow = Rat and Delarof Islands, Green = Adak and Kanaga, Blue = Atka, Purple = Umnak, White = Unalaska. Error bars are smaller than the symbols. In 3) and 4), the Holocene volcanics are separated by location only without age differences. Figures from Cai et al., Earth Planet Sci. Lett. 2015.

“Report from the Field” was designed to inform the community of real-time, exciting GeoPRISMS -related research. Through this report, the authors expose the excitement, trials, and opportunities to conduct fieldwork, as well as the challenges they may have experienced by deploying research activities in unique geological settings. If you would like to contribute to this series and share your experience on the field, please contact the GeoPRISMS Office at info@geoprisms.nineplanetsllc.com. This opportunity is open to anyone engaged in GeoPRISMS research, from senior researchers to undergraduate students.
We hope to hear from you!

Reference information
Investigating older rocks in the oceanic Aleutian volcanic arc east of Adak
GeoPRISMS Newsletter, Issue No. 36, Spring 2016. Retrieved from http://geoprisms.nineplanetsllc.com