GeoPRISMS data portal was established in 2011 to provide convenient access to data and information for each primary site as well as to useful data resources.
Since the last newsletter report, the database group participated in the GeoPRISMS East African Rift System implementation meeting, holding a hands-on data workshop there, and in the AGU mini-workshop on Cascadia science. The on-line GeoPRISMS bibliography was also much expanded. Highlighted below are some recent contributions of field program information and data of interest to the GeoPRISMS community.
Cascadia
Cascadia Initiative Year 2 OBS operations continued throughout the autumn (Fig. 1). Oceanus cruise OC1208B led by Doug Toomey and Susan Schwartz oversaw the deployment of 15 trawl-resistant OBS instruments which are designed to avoid snagging from commercial fishing nets. That was followed by the last cruise of the field season, leg 6 – Oceanus cruise OC1209A – during which chief scientists Anne Tréhu and Jeff McGuire and their team deployed a further 14 trawl-resistant devices along with 10 traditional OBSs. Year 2 OBSs will be recovered in 2013. Field program information and links to data for each Cascadia Initiative cruise are available via the GeoPRISMS data portal.
The focus upon adding more multibeam swath data to a bathymetric compilation for Cascadia has continued. Due out in April 2013, version 2.4 of the Global Multi-Resolution Topography synthesis is used as the base map in GeoMapApp and will incorporate sonar data from an additional 8 cruises, including the dedicated survey done in summer 2011 by OSU’s Chris Goldfinger and Chris Romsos aboard Thompson leg TN265.
ENAM
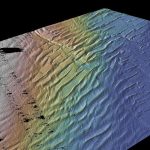
The summer 2012 survey cruise RB1202 (chief scientists Armstrong, Calder, Gardner, and Johnson, all at UNH) completed sonar imaging of the ENAM region under the Law of the Sea program. The resultant bathymetry and backscatter grids can be viewed in GeoMapApp under the ENAM focus site menu with examples shown in Fig 3.
-
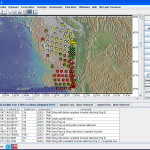
- Figure 1. Four years of Cascadia Initiative OBS deployments covering much of the Juan de Fuca and Gorda plates along the Cascadia margin are plotted on the most recent bathymetry and land elevation compilation of the Global Multi-Resolution Topography synthesis. Grey circles – Year 1 surveyed-in OBS locations; red squares – year 2 best-available locations; yellow triangles and green stars – year 3 and year 4 planned OBS deployment locations, respectively.
-
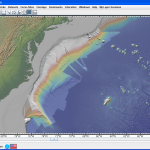
- Figure 3. In GeoMapApp’s 3-D perspective viewer (lower right image), large ENE-WSW-trending current-generated sand waves with amplitudes of up to 150m are clearly visible in the built-in Law of the Sea bathymetry data. The perspective view is from the SW for the area shown by the red box, and artificial illumination is from the north. In the GeoMapApp map window (upper left), the full extent of the Law of the Sea bathymetry grid is made visible by the lighter hues along the margin. Law of the Sea backscatter data covers the same area. Onshore, high-resolution USGS NED elevation data delineates the Appalachians and coastal plains.
GeoPRISMS Data Portal Tools & Resources
Search For Data. With this customised GeoPRISMS interface, search for data by key word, NSF award number, data sets related to publications, or within a geographical box.
Data Management Plan tool – Generate a data management plan for your NSF proposal. The on-line form can be quickly filled in, printed in PDF format and attached to a proposal. We also have developed a tool to help PIs show compliance with NSF data policies.
GeoPRISMS Bibliography – This integrated, searchable GeoPRISMS bibliography now contains all references from the GeoPRISMS Science Plan, bringing the total citations to more than 600, with papers tied to associated data sets. Searching can be done by primary site, paper title, author, year, and journal. The lists of publications can also be exported to EndNote™. To help grow the number of relevant citations, community members can submit references information using a handy web form linked to the bibliography web page.
GeoMapApp and Virtual Ocean GeoMapApp – It is a free map-based data exploration and visualization tool. Enhancements in version 3.3.6 include improved caching of menus for faster start-up times, better handling of imported Excel™ spreadsheets and, for GeoPRISMS, additional data sets and tables available through the Focus Site menus (see Fig. 2). Coming in April is an updated multi-resolution base map. Use GeoMapApp to generate custom maps, to explore built-in data sets and to import your own data tables, spreadsheets, grids, images and shapefiles. Multimedia audio-visual tutorials are available on the GeoMapApp web page and on YouTube™. Virtual Ocean, version 2.5.6, offers GeoMapApp-style capabilities in a virtual globe environment.
Contribute Data – This simple web tool allows users to submit grid files, tabular data sets including those in spreadsheet format, and shapefiles. Once added to the GeoPRISMS database, these data sets become available to the broader community immediately or can be placed on restricted hold until made public.
GeoPRISMS MediaBank – Access GeoPRISMS-related images including photos from field expeditions. Please send compelling images for inclusion in the gallery!
The GeoPRISMS data portal team is here to help the community. Please contact us at info <at> marine-geo.org.