Wednesday December 4, 2011, 9:00 – 5:00 PM
Conveners: Robert Stern, Mark Feigenson, Kerstin Lehnert, Andrew Goodwillie, Peter Van Keken, Jun-Ichi Kimura, Brian Dreyer, Erika Jordan, Warren Lieu
Geochemical databases and how to access them – Kerstin Lehnert
Break
GeoMapApp (including depth from volcano to slab)- Andrew Goodwillie
Break
Central America and Izu-Bonin-Mariana Arc Geochemical Database – Erika Jordan
LUNCH
Intro to slab thermal structure – Peter van Keken
Break
Introduction to Arc Basalt Simulator 3.1 – Jun-Ichi Kimura
Break
ABS exercise
 This short course is intended to help students, faculty, and researchers develop skills for mining data from EarthChem about the composition of arc lavas, visualize the location and important physical parameters of these volcanoes on GeoMapApp, and explore the petrogenesis of primitive lavas with a new Excel spreadsheet-based petrogenetic program “ABS 3” (Kimura et al., 2010). The course will comprise a variety of exercises and short lectures to explore and explain how these 3 software tools work together to address problems in convergent margin magma genesis. The course integrates use of geochemical databases, data visualization tools, and data analysis software with background knowledge about geoinformatics, relational databases, and data reporting. We will distribute ABS 3 spreadsheets and tutorials to participants before the workshop.
Participants should bring a laptop to the workshop.
1University of Texas, Dallas; 2Rutgers University; 3Lamont-Doherty Earth Observatory; 4University of Michigan; 5IFREE, JAMSTEC; 6University of California, Santa Cruz
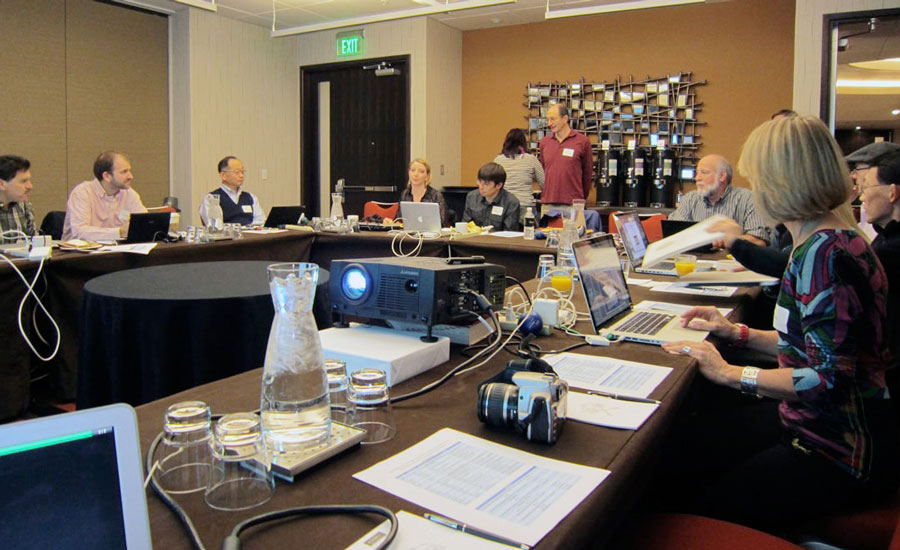
Twenty geoscientists attending Fall AGU forsook the chance to enjoy a beautiful Sunday in San Francisco on December 4, 2011, and chose instead to descend into the bowels of the Grand Hyatt for the chance to explore how geoinformatics can help geoscientists understand the composition and generation of convergent margin magmas. The all-day workshop was organized in support of the science goals of the GeoPRISMS Subduction Cycles and Deformation (SCD) Initiative. SCD aims to understand how subduction zones work, from cold, shallow regimes (accretionary prism, forearc crust, and the seismogenic zone) to deeper, hotter regions where fluids and melts from the subducted slab trigger melting in the convecting asthenosphere above it. SCD builds on and integrates the successes of the predecessor MARGINS Seismogenic Zone and Subduction Factory experiments, targeting the Aleutian and Cascade arcs as community-chosen focus sites. The techniques and insights developed from studies of these arcs can be applied globally, and we hope to attract more geoscientists to join the “subduction parade”. In our efforts to involve a more diverse group of geoscientists in this effort – from students to university professors to expert researchers – we need to develop better, more accessible tools for this community to use. The Geoinformatics workshop was an effort to attract new members of the GeoPRISMS SCD team and help prepare these geoscientists.

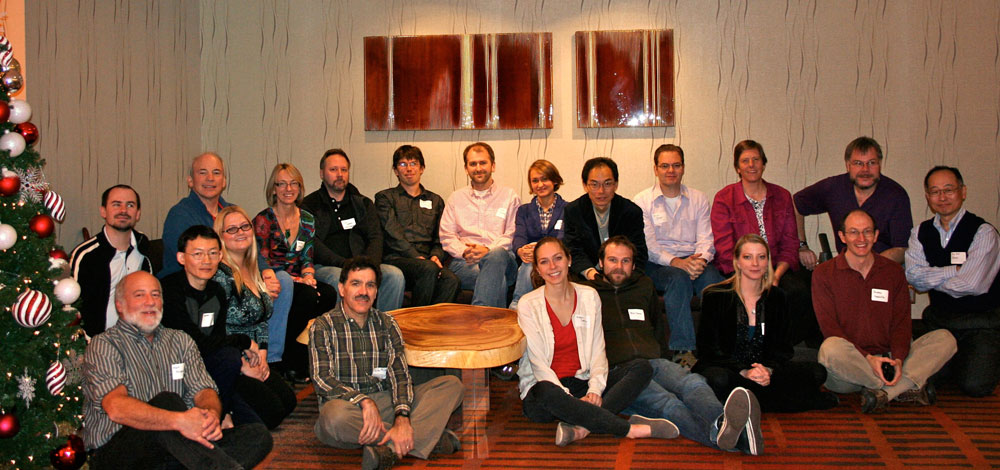
Figure 1, Dec. 2011 GeoPRISMS geoinformatics workshop participants. Front row (L to R): M. Feigenson, Warren Lieu, Erika Jordan, Peter Michael, Megan Derrico, Nick Deems, Sara Douglas, Andrew Goodwillie, Jun-ichi Kimura. Back row: Charles Bopp, Bob Stern, Kerstin Lehnert, Guillaume Girard, Tyrone Rooney, Katherina Vogt, Osamu Ishizuka, Brian Dreyer, Julia Morgan, Peter van Keken

Using Geoinformatics Resources to Explore the Generation of Convergent Margin Magmas | AGU 2011
These are lofty goals that can only be realized if interested geoscientists gather to explore effective tools and how they can be used. The most important community tools are databases, data visualizations, and data analysis software. Examples of each of these were highlighted in the workshop, as is clear from the agenda below (with pertinent links and other information). Each 50 minute long session encouraged questions and comments from workshop participants and was followed by a 10-minute break that allowed folks to stretch and refuel with plenty of food and beverages provided by GeoPRISMS.
- Geochemical databases and how to access them – Kerstin Lehnert (LDEO) explained how geochemical databases such as PetDB, Georoc, SedDB, and NAVDAT (all of which can be accessed via Earthchem) are increasingly important aspects of teaching and research (including GeoPRISMS SCD). Kerstin also explained how the new SESAR (System for Earth Sample Registration) can resolve problems of sample ambiguity (for example: how many samples have the same ID, e.g., how many “D1” samples are there in dredge collections around the world?) and data redundancy (for example: how many samples have been analyzed multiple times for different elements and isotopes, each reported with slightly different IDs that are entered separately into one or more databases?). Kerstin emphasized how important it was that samples studied as a result of GeoPRISMS SCD should each be registered for(International Geo Sample Number), a 9-digit alphanumeric code that uniquely identifies samples and provides information about where these can be found.
- Data Visualization Tool: GeoMapApp – GeoMapApp is an Earth science exploration and visualization application that is maintained and improved as part of the Marine Geoscience Data System at LDEO. There are several YouTube GeoMapApp multimedia tutorials that can be accessed. Of special interest to this workshop is the fact that GeoMapApp has a new feature that allows users to determine the depth of the subducted slab beneath a given arc volcano, and one tutorial shows how to do this, using the global compilations of Syracuse and Abers (2006).
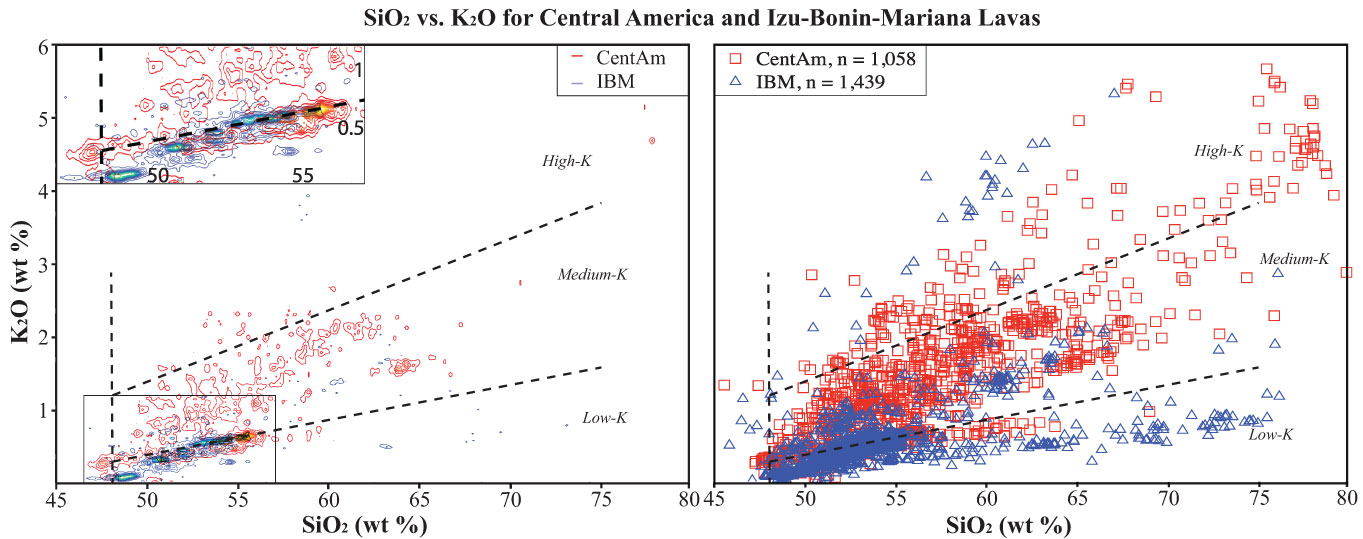
- Central America and Izu-Bonin-Mariana arc geochemical databases – Erika Jordan and Warren Lieu (UT Dallas). CentAm and IBM were focus sites for the MARGINS Subduction Factory experiment and geochemical data for these from EarthChem have been compiled and are being filtered so that these can be made available as an Earthchem data library. Erika summarized the status of compilations for volcanic front lavas from these two focus sites, using graphs to show their geochemical similarities and differences. Once completed, these compilations will be available to anyone as a Geochemical Reference Library. One of the important issues related to such compilations is how to best show these data. There are hundreds to thousands of data points in these compilations, so individual points on graphs often lie on top of each other and it can be difficult to see underlying structure. Warren showed how large data sets can be contoured and it is clear that making such data visualization tools available will be key for exploiting large geochemical data sets.
- Thermal structure of subducted slabs – Modeling the thermal structure of subduction zones and using geochemical and geophysical data to test and refine these models is leading to some of the most rewarding collaborations between geodynamic modelers, geophysicists, and geochemists. After lunch, Peter van Keken (U. Michigan) presented some of the latest thinking about how lithosphere age and convergence rate control temperatures in subduction zones. It is the slightly (~1%) more dense nature of the ~100 km thick lithosphere relative to ambient mantle that makes plates subduct, but it is the thin veneer of subducted sediments and the upper, altered portion of the oceanic crust– typically only a few tenths of a percent of everything that is subducted – that controls the subduction zone incompatible element budget. We cannot understand the trace element and isotopic composition of arc lavas without understanding how sediments are cooked in the subduction zone kitchen. Subducted sediments lie athwart a very strong temperature gradient between hot convecting asthenosphere and cool conducting lithosphere, so it is not surprising that our thinking has fluctuated between a consensus that subducted sediments beneath the arc mostly are sufficiently cool that they only release hydrous fluids to the idea that they are mostly hot enough to melt. Thermal models for subducted sediments need to be tested and refined with geophysical and geochemical data and experiments.
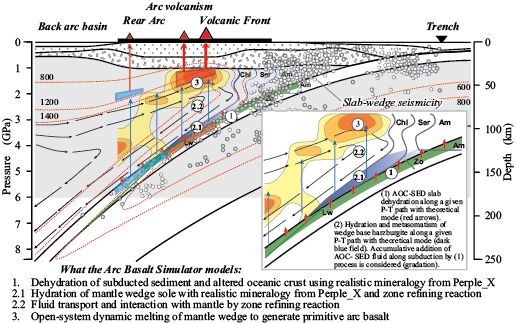
- Introduction to Arc Basalt Simulator 3.1 – Jun-ichi Kimura (JAMSTEC/IFREE) presented the theoretical underpinnings of an evolving software package for understanding arc petrogenesis, called “Arc Basalt Simulator”, or “ABS”. ABS is a forward model designed to match the incompatible trace element and radiogenic isotopic composition of primitive (high Mg#) arc lava by inputting appropriate subducted sediment and altered oceanic crust compositions and compositions of unmodified mantle wedge, choosing an appropriate subduction zone thermal model (from Syracuse et al., 2010) and adjusting some other subduction zone parameters, such as where fluids or melts are extracted from the downgoing slab and the depth of mantle melting. ABS is an Excel-based spreadsheet that can be run on any PC or Mac, so all members of the GeoPRISMS SCD community can use it. A tutorial walks the new user through the various functions of ABS 3.1. The ABS spreadsheet and ABS tutorial can be downloaded from the Geochemical Resource Library. A recent paper (Kimura et al., 2010) uses ABS version 3.1 to investigate compositions of primitive magmas along the Izu arc, and a new version (ABS 4) is being developed by Dr. Kimura and colleagues.
- ABS exercise – Bob Stern (UTD) and Mark Feigenson (Rutgers) provided some practical experience with ABS3.1. Bob walked workshop participants through each of the ABS3.1 user-adjustable functions, then Mark showed the group how ABS 3.1 could be used to understand the composition of primitive Cerro Negro (Nicaragua) lavas.
 There are some useful lessons to be learned for others considering proposing future workshops before or after national geoscientific meetings like AGU or GSA. It is important to start planning early so that possible participants have the workshop on their “radar screens” before they buy their air tickets for the meeting, and so these societies can include the workshops on meeting announcements. In addition, workshop conveners should make a strong push to advertise the workshop at least two months before the meeting, in order to maximize workshop attendance. The conveners would be happy to discuss other considerations with people thinking about proposing a GeoPRISMS workshop.
