Imaging Magma Under Mount St. Helens with Geophysical and Petrologic Methods


Carl W Ulberg1 and the iMUSH Team*

*The iMUSH team includes Geoffrey A Abers2, Olivier Bachmann3, Paul Bedrosian4, Dawnika L Blatter4, Esteban Bowles-Martinez5, Michael A Clynne, Kenneth C Creager1, Kayla Crosbie2, Roger P Denlinger⁴, Margaret E Glasgow⁶, Jiangang Han1, Steven M Hansen⁶, Graham J Hill⁷, Eric Kiser⁸, Alan Levander⁹, Michael Mann2, Xiaofeng Meng1, Seth C Moran⁴, Jared Peacock⁴, Brandon Schmandt⁶, Adam Schultz⁵, Thomas W Sisson⁴, Roque A Soto Castaneda2, Weston A Thelen⁴, John E Vidale1, Maren Wanke3

1University of Washington, 2Cornell University, 3ETH-Zurich, ⁴USGS, ⁵Oregon State University, ⁶University of New Mexico, ⁷University of Canterbury, ⁸University of Arizona, ⁹Rice University
iMUSH is funded by NSF-GeoPRISMS, NSF-Earthscope with substantial in-kind support from the USGS.

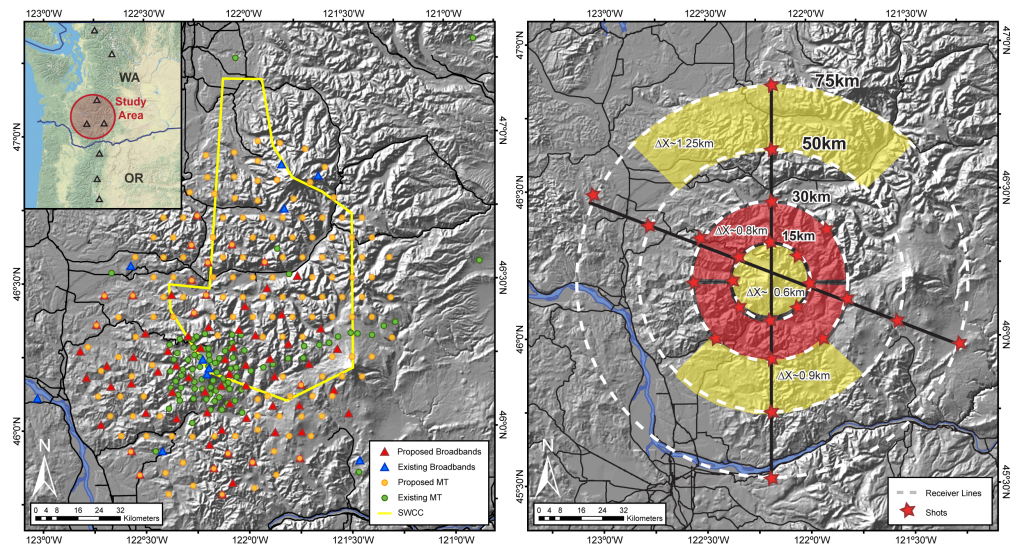
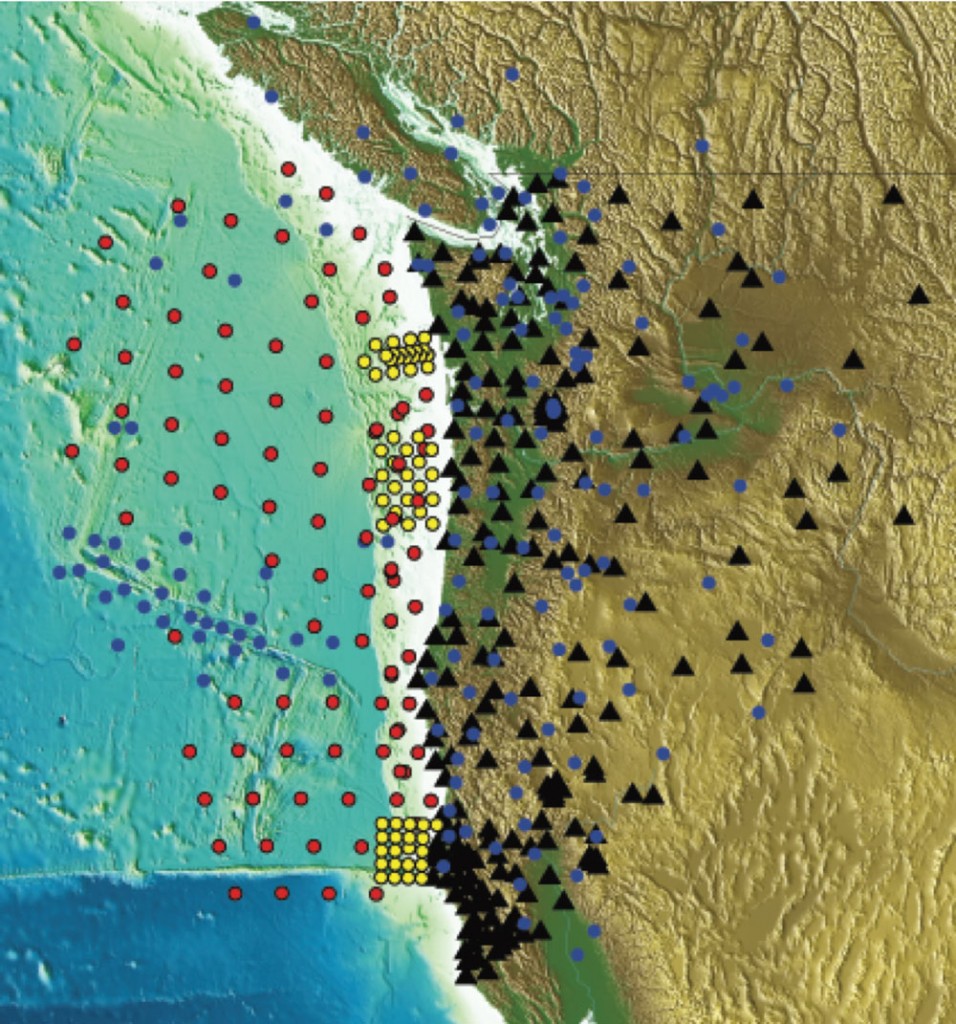
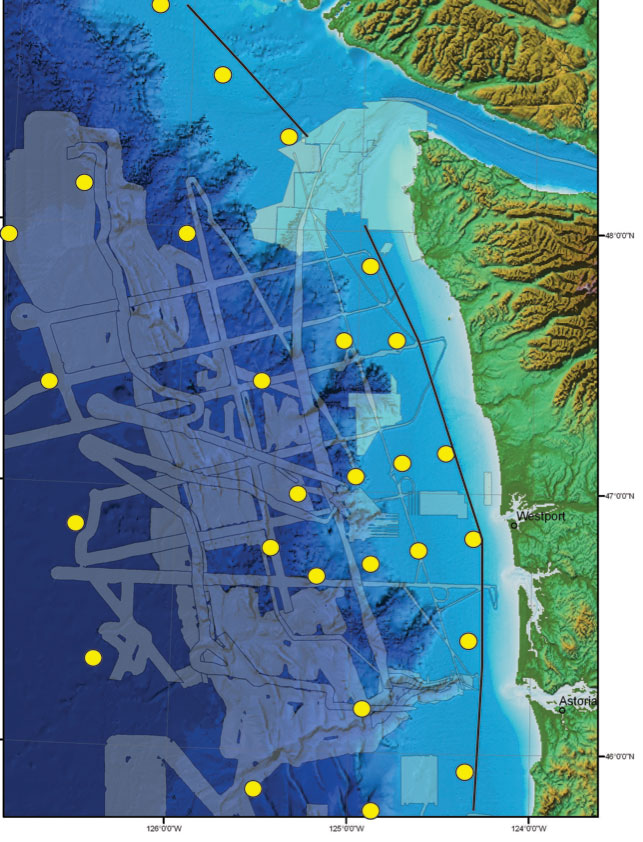
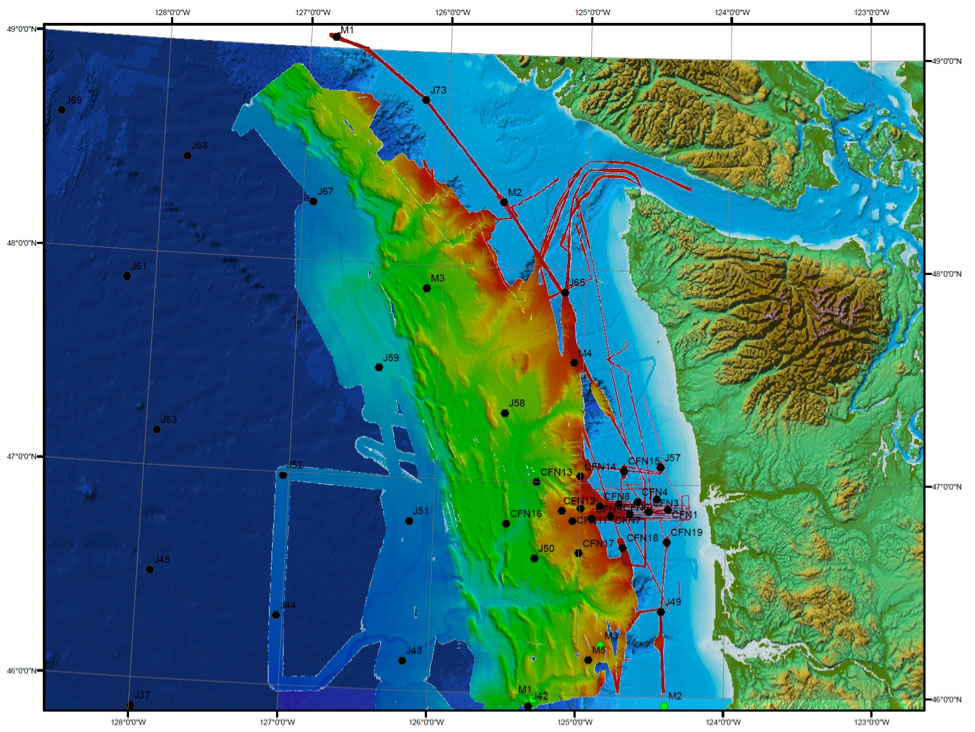
The imaging Magma Under Mount St. Helens (iMUSH) experiment aims to illuminate the magmatic system beneath Mount St. Helens (MSH) from the subducting Juan de Fuca Plate to the surface using multiple geophysical and petrologic techniques. Field work involved seventy broadband seismometers deployed from 2014 to 2016, 23 active shots set off in the summer of 2014 recorded at about 5000 sites with Texan instruments and 950 additional Nodal stations, 150 new magnetotelluric measurements, and new petrologic sampling and analysis (Fig. 1).

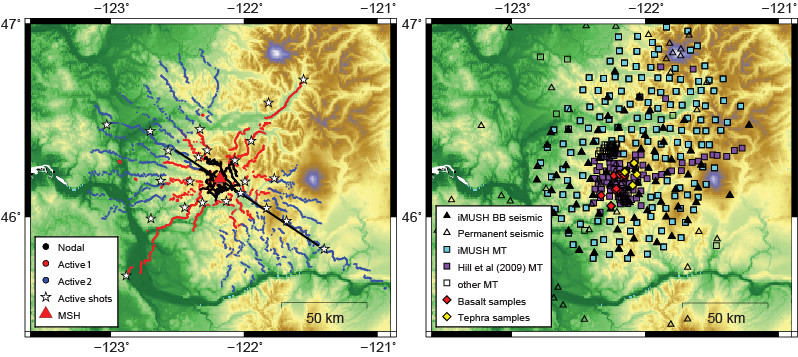
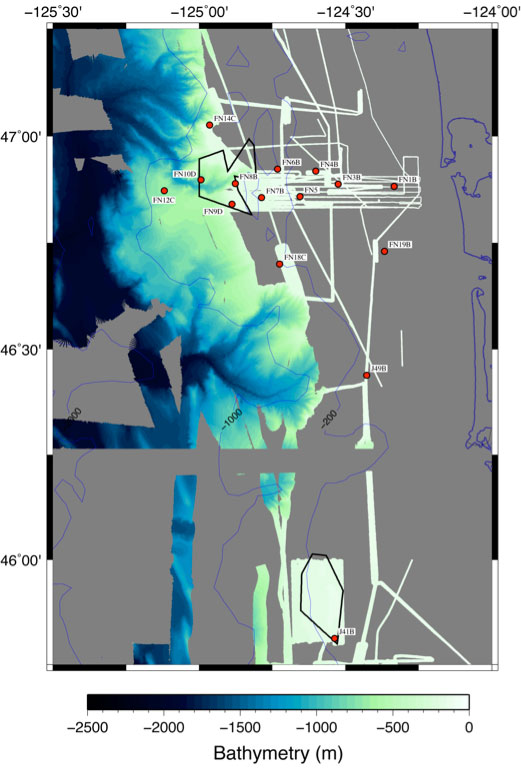
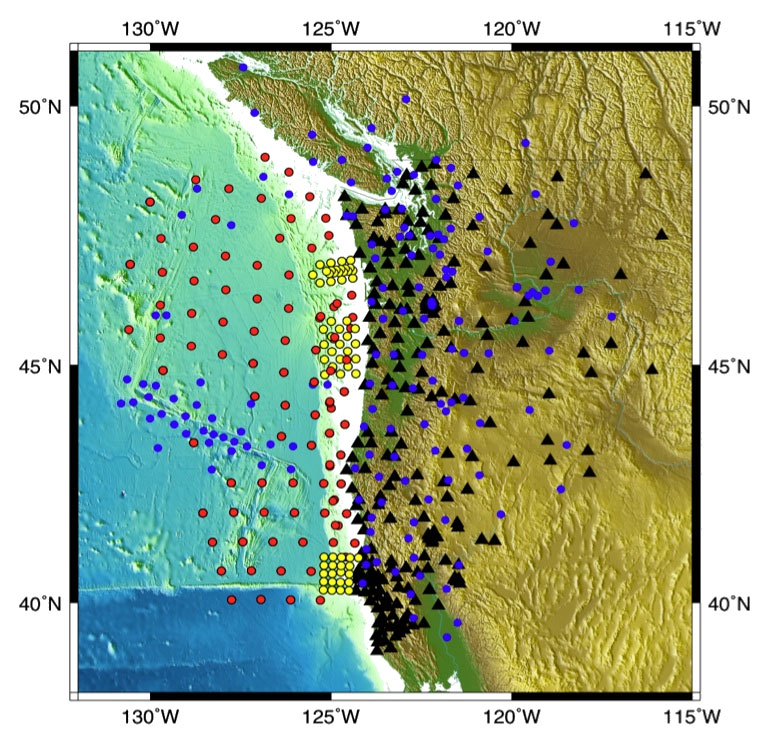
Figure 1. Left: Map of the active source deployment. In the summer of 2014, 23 shots were recorded by about 2500 Texan seismometers installed in two deployments, in addition to 950 Nodal seismometers. The black line shows the location of cross-sections in Figure 2. Right: Locations of permanent and temporary broadband seismometers used in the passive source experiment, magnetotelluric sites, and petrologic samples.

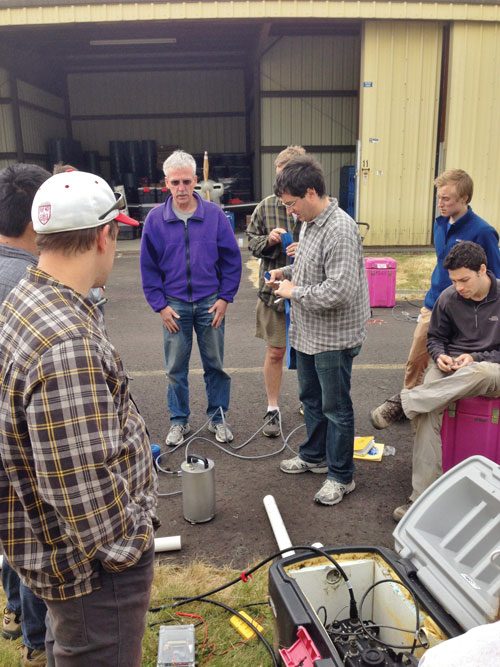
In June 2017, about twenty iMUSH scientists met at the USGS Cascades Volcano Observatory in Vancouver, WA, to discuss emerging iMUSH results and to integrate those results into a consistent model of the crust and upper mantle under Mount St. Helens. Some results have been published already and many more are on their way to publication.

Passive seismic techniques include local earthquake tomography, ambient noise tomography, receiver function imaging, attenuation tomography, and SKS anisotropy. Using these techniques, we can image portions of the crust and mantle from the subducting slab to the surface, at varying degrees of resolution. Principal investigators for this portion of the experiment are Ken Creager, Geoff Abers, and Seth Moran, plus several students mentioned below.

Local earthquake tomography imaging is limited to the upper 20 km of the crust. Using more than 10000 first arrival picks for P- and S-waves from 400 local earthquakes, Carl Ulberg imaged surface-mapped features such as several high-velocity Miocene plutons, and the low-velocity Indian Heaven volcanic field and Chehalis sedimentary basin. Deeper features include the low-velocity Mount St. Helens seismic zone (SHZ), and low velocities at depths of 6-15 km below sea level beneath MSH, possibly related to a shallow magma storage region that has been identified previously with seismic studies and constrained by petrology (Fig. 3; Scandone and Malone, 1985; Lees and Crosson, 1989; Waite and Moran, 2009).

Ambient noise tomography involves cross-correlating the seismic noise between all of the station pairs in the array, and inverting the phase velocity maps to obtain a 3-D shear wave model of the crust and upper mantle. Using this technique, Kayla Crosbie found a general trend of high velocities in the lower crust to the west of MSH, and lower velocities to the east. This could be related to the presence of the accreted Siletz terrane (oceanic basalt from ~50Ma) to the west, and/or high temperatures and partial melt in the lower crust to the east (Fig. 2).

Receiver functions record the arrival of reflected and converted waves from teleseismic earthquakes. This technique is useful for locating interfaces with strong velocity discontinuities, since these reflect waves efficiently. Using this technique, Michael Mann imaged the subducting Juan de Fuca slab at a depth of ~70 km beneath MSH, and ~100 km beneath Mount Adams, almost 50 km to the east. Roque Soto used teleseismic attenuation tomography to model attenuation in the area around MSH. Abe Wallace and Erin Wirth used shear wave splitting of SKS phases to infer a fast direction of anisotropy aligned NE-SW, consistent with regional trends.

The active source experiment has yielded several results including 2-D Vp and Vs profiles through MSH down to the Moho, a map of the reflectivity of the Moho beneath MSH, and details of the locations and characteristics of seismic sources beneath MSH.

Using thousands of observations of the 23 active shots, Eric Kiser and Alan Levander obtained 2-D seismic velocity profiles through MSH (Kiser et al, 2016), and are working on a 3-D inversion of the same data.

The model includes a low-velocity zone in the lower crust 10-20 km SE of MSH, hypothesized to be a potential magma storage region as magma makes its way from the mantle to be erupted at MSH. This low-Vp zone corresponds spatially with the low-Vs zone imaged with ambient noise tomography (Fig. 2). High Vp/Vs regions in the upper crust beneath MSH and Indian Heaven could correspond to areas with partial melt, at active Holocene eruptive centers. The 3-D active source seismic imaging reveals similar features in the upper 15-20 km as imaged by the local earthquake tomography (plutons, sediments, etc.).

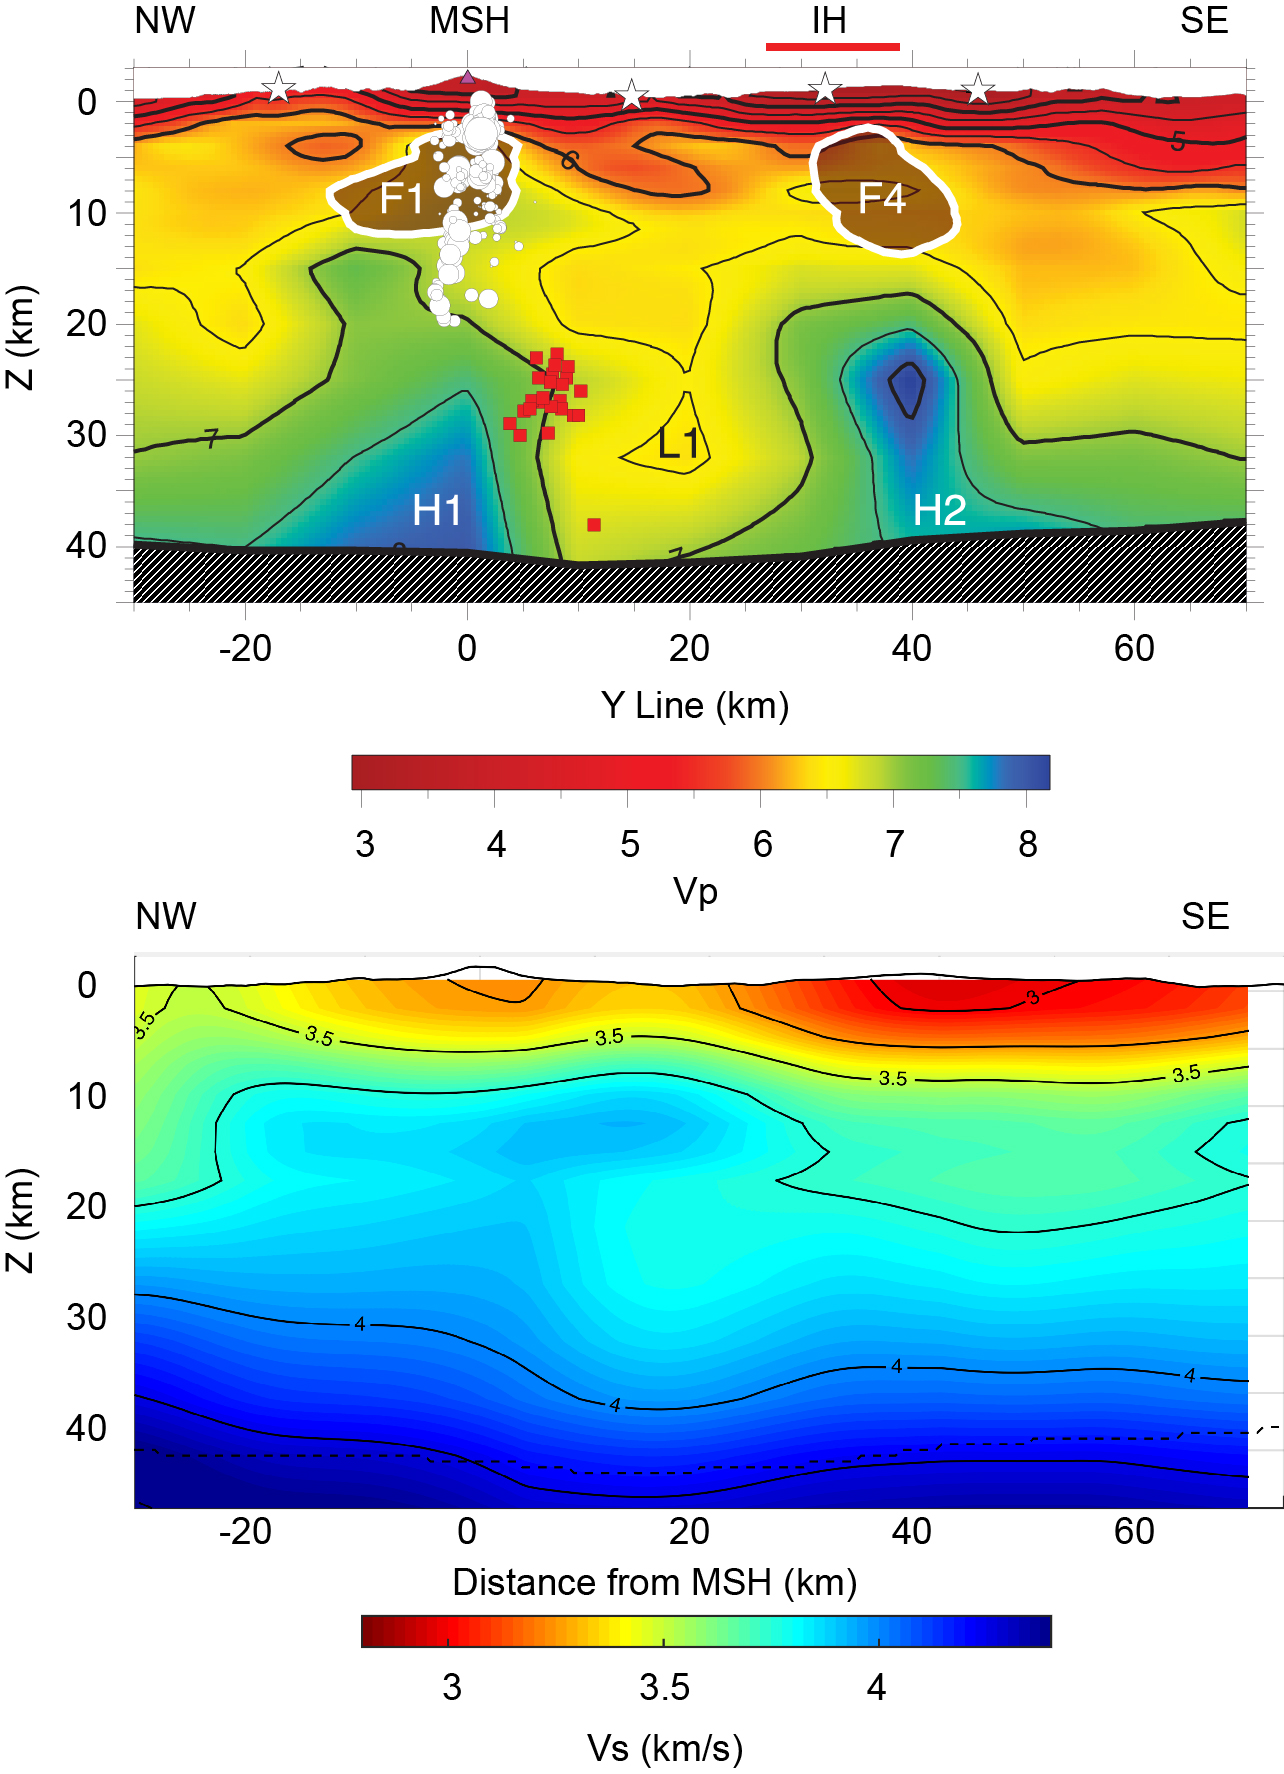
Figure 2. Top: NW-SE cross-section through MSH and the Indian Heaven volcanic field (IH) from Kiser et al (2016), showing high Vp (H1, H2), low Vp (L1) and high Vp/Vs anomalies (F1, F4). White dots are earthquakes during the first 24 h following the 18 May 1980 eruption, red squares are deep long-period event locations since 1980, white stars are active shot locations. Bottom: Cross-section along the same NW-SE line through the ambient noise tomography Vs model. High and low velocities in the lower crust are in similar locations as the active source model. The dotted line is the location of the Moho in the upper panel.

During the active source experiment, 950 Nodal stations were deployed for two weeks on and around the edifice of MSH. Steve Hansen and Brandon Schmandt stacked these data to reveal details of the reflectivity of the Moho, the boundary at the base of the continental crust (Hansen et al, 2016). They found large amplitude reflected waves to the east of MSH but little evidence for reflected waves to the west. This indicates that there is a stronger velocity contrast between the lower crust and upper mantle to the east of MSH than to the west. This could be related to the presence of a serpentinized mantle wedge, which would lower the velocity of the upper mantle. Due to its lower temperature, this probably also precludes the possibility of magma derived from the mantle wedge directly beneath MSH. Instead, it would have to come from somewhere to the east, an idea also supported by the active seismic and noise cross-correlation results.

Using the dense instrumentation on and around MSH, seismic sources can be better-characterized as well. Deep long-period earthquakes have been observed beneath MSH since sufficient instrumentation was installed around the time of the 1980 eruption. Using cross-correlation techniques, Jiangang Han determined that almost all of these events actually occurred in the same place, a location ~5-10 km SE of MSH at a depth of 22-30 km below sea level. Margaret Glasgow, Hansen, and Schmandt worked with the Nodal data to locate and characterize an order of magnitude more shallow events than were in the Pacific Northwest Seismic Network catalog. Xiaofeng Meng and John Vidale obtained a high-resolution set of seismic locations within 5-km depth of MSH with double-difference relocations using accurate 3-D velocity models.

The iMUSH magnetotelluric experiment, led by Adam Schultz (OSU) and Paul Bedrosian (USGS), collected data at 150 sites within the broad area encompassing Mounts St. Helens, Rainier, and Adams. These data were supplemented by a denser set of data collected ~10 years previously in the immediate area around MSH (Hill et al, 2009). A primary aim of the magnetotelluric study is to obtain a more detailed image of what has been termed the Southwest Washington Cascades Conductor (Stanley et al, 1987). Three-dimensional resistivity modeling by Jared Peacock, Esteban Bowles-Martinez, Bedrosian and Schultz imaged a ring of high conductivity extending NNW from MSH, east under the Cowlitz River, south along the western edge of the Cascades arc, and west beneath Indian Heaven.

Much of the high conductivity overlaps with low velocities imaged by seismic tomography (Fig. 3). The origin of the high conductivity is somewhat enigmatic. One theory is that the high-conductivity reflects contact metamorphism of Eocene marine sediments along the margins of a large Miocene intrusion, emplaced in or near the suture zone between the Siletz terrane and the Mesozoic North American margin. That Mount St. Helens sits directly atop this conductive ring may shed light on both its unusual forearc location and predominantly dacitic composition. A more subtle conductor imaged within the lower-crust may be related to a small degree of partial melt which may in turn source surface volcanism.

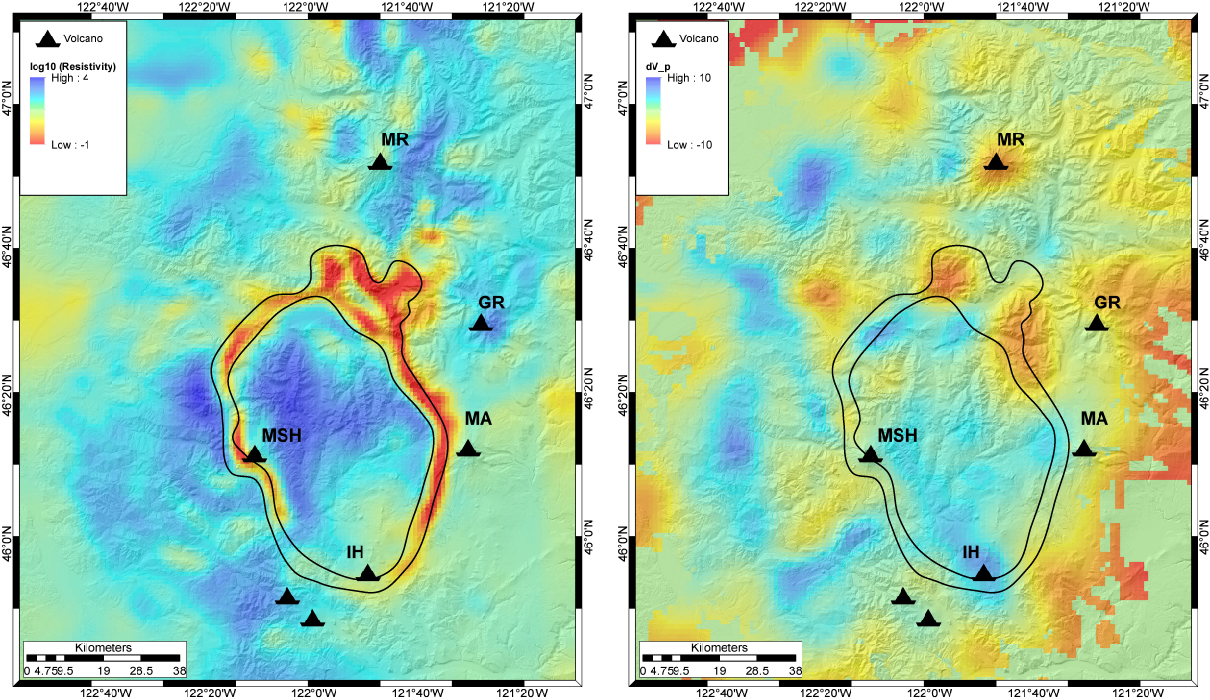
Figure 3. Left: Magnetotelluric model at 7km depth, showing details of high conductivities between MSH, Mount Rainier and Mount Adams (black outline). Scale is log10 (resistivity), so red areas are highly conductive. Triangles are volcanoes. Right: Local earthquake tomography Vp model at the same depth, showing percent variation from a 1-D average velocity model, masked for areas without raypaths. Several low-Vp anomalies coincide spatially with high conductivities in the MT model (black outline shows high conductivity).

Petrologic studies conducted on rocks collected near MSH have revealed several new insights into the magmatic system. Three mafic endmembers are encountered at MSH: high-K basalts (Type 1), low-K basalts (Type 2), and arc-type basaltic andesites (Type 3). The distinct geochemical characteristics of each mafic type require variable contributions of flux and decompression melts, involving different sources in the mantle, possibly including asthenospheric upwelling through a slab tear or gap beneath northern Oregon (Obrebski et al, 2010). The preservation of their mantle signatures requires separate ascent pathways through the crust (likely along re-activated fractures) for distinct batches of basalt aside from the main plumbing system. Further, petrographic observations made by Maren Wanke, Olivier Bachmann, and Michael Clynne indicate frequent mixing of some basalt types with the silicic upper part of the system, producing magmatic cycles of basalt entraining a dacitic magma reservoir, mixing, fractionating and erupting the diverse magmas of the Castle Creek period (~1900-1700 years B.P.). However, dacites are the most abundant rock type at MSH and the eruption of basalt remains a rarity. Hydrous arc-type basaltic andesite (Type 3), presumably the most abundant type of mafic magma produced in the mantle, is likely feeding the main magmatic plumbing system to form dacites in a lower crustal mush zone, which is possibly being imaged by the active source, ambient noise, and magnetotelluric studies.
Two voluminous dacitic tephra units from MSH over the last 4 ka were also sampled and studied using near-liquidus, fO2-buffered inverse experiments over a range of pressures, temperatures and H2O concentrations (Blatter et al, 2017).

The results of these experiments indicate that the dacite liquid is generated at deep crustal pressures (700-900 MPa, ~20-35 km) and moderate temperatures (925°C), with high H2O concentrations (6-7 wt%) and high fO2 (~NNO+1.3). Mass balance calculations using the mineral and liquid compositions from the experiments indicate that crystallization of an H2O-rich basaltic andesite (similar to Type 3), or re-melting a vapor-charged hornblende gabbro can generate large quantities (~35 wt%) of hydrous dacite, implying that regular recharge of the system by H2O-rich basalts, basaltic andesites, or vapor is necessary for the persistent production of dacitic melt consistent with the eruptive history of MSH.

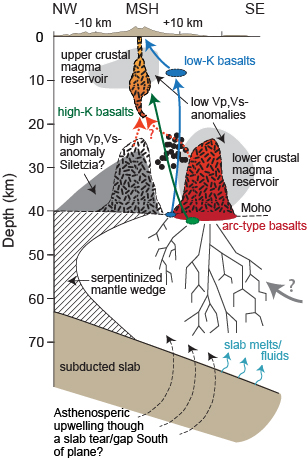
Figure 4. Schematic cross-section through the crust and mantle beneath MSH including a lower and upper crustal magma reservoir (dashed lines) inferred from low P-wave (Vp), S-wave (Vs) velocity anomalies (shaded areas) (Kiser et al., 2016) and the position of deep long period earthquakes (black dots). The outline of the upper crustal magma reservoir is inferred from earthquake locations of the 1980 eruptions (Scandone and Malone, 1985). Colored arrows indicate separate pathways through the crust for the different mafic endmembers: high-K basalts, low-K basalts and arc-type basaltic andesites. The serpentinized mantle wedge is inferred from seismic data of Hansen et al. (2016). Figure provided by Maren Wanke.

Several features are consistently observed in geophysical surveys and match inferences from petrological clues (Fig. 4). Local and active source tomography, place an anomalous region in the upper crust at depths of 5-15 km below sea level beneath MSH. The likely explanation for this is an upper crustal storage region for evolved magma, some of which will likely erupt at MSH in the future. In the lower crust, ambient noise tomography and reflected waves from active source tomography point towards a low-velocity region to the east or SE of MSH, which could be related to lower crustal magma storage. Magnetotelluric results are also consistent with a small degree of lower-crustal partial melt, although the spatial extent of such melt is not in complete accordance with that inferred from seismic tomography. Since MSH is located anomalously trenchward for a Cascades volcano, with a slab depth of ~70 km directly beneath MSH, an offset magma pathway is possible. Deep long-period earthquakes may indicate the presence of magmatic fluid along this pathway. Low velocities and high conductivity are observed along the SHZ, which could be related to higher temperatures and fractured rock, fluids, and/or the presence of metasedimentary rocks within the Eocene Siletz suture zone. Upper crustal features are also consistent across local, active source, and ambient noise tomography, giving us a better idea of the upper crustal structure of the region, including multiple Miocene-aged plutons and sedimentary basins. ■

References

Blatter, D.L., T.W. Sisson, and W.B. Hankins, (2017), Voluminous arc dacites as amphibole reaction-boundary liquids. Contributions to Mineralogy and Petrology, 172(5), 27.
Hansen, S.M., B. Schmandt, A. Levander, E. Kiser, J.E. Vidale, G.A. Abers, and K.C. Creager, (2016), Seismic evidence for a cold serpentinized mantle wedge beneath Mount St Helens. Nature Communications, 7, 13242.
Hill, G.J., T.G. Caldwell, W. Heise, D.G. Chertkoff, H.M. Bibby, M.K. Burgess, J.P. Cull, and R.A.F. Cas, (2009), Distribution of melt beneath Mount St Helens and Mount Adams inferred from magnetotelluric data. Nature Geoscience, 2(11), 785-789.
Kiser, E., I. Palomeras, A. Levander, C. Zelt, S. Harder, B. Schmandt, S.M. Hansen, K.C. Creager, and C. Ulberg, (2016), Magma reservoirs from the upper crust to the moho inferred from high-resolution Vp and Vs models beneath Mount St. Helens, Washington State, USA. Geology, 44(6), 411-414.
Lees, J., and R. Crosson, (1989), Tomographic inversion for 3-dimensional velocity structure at Mount St. Helens using earthquake data. Journal of Geophysical Research-Solid Earth and Planets, 94(B5), 5716-5728.
Obrebski, M., R.M. Allen, M. Xue, and S. Hung, (2010), Slab-plume interaction beneath the Pacific Northwest. Geophysical Research Letters, 37, L14305.
Scandone, R., and S. Malone, (1985), Magma supply, magma discharge and readjustment of the feeding system of Mount St. Helens during 1980. Journal of Volcanology and Geothermal Research, 23(3-4), 239-262.
Stanley, W., C. Finn, and J. Plesha, (1987), Tectonics and conductivity structures in the southern Washington Cascades. Journal of Geophysical Research-Solid Earth and Planets, 92(B10), 10179-10193.
Waite, G.P., and S.C. Moran, (2009), V-P structure of Mount St. Helens, Washington, USA, imaged with local earthquake tomography. Journal of Volcanology and Geothermal Research, 182(1-2), 113-122.

Reference information
Imaging Magma Under Mount St. Helens with Geophysical and Petrologic Methods. C. Ulberg and the iMUSH Team
GeoPRISMS Newsletter, Issue No. 39, Fall 2017. Retrieved from http://geoprisms.nineplanetsllc.com

iMUSH: Imaging Magma Under St. Helens


Carl Ulberg (University of Washington) and members of the iMUSH field team

The imaging Magma Under St. Helens (iMUSH) experiment is a collaborative research project involving several institutions with an aim to illuminate the magmatic system beneath Mount St. Helens, WA, from the slab to the surface. A variety of geophysical imaging techniques (magnetotelluric, active-source, and passive-source seismology) are being used in conjunction with geochemical and petrologic data to image and interpret the crust and upper mantle in the greater Mount St. Helens (MSH) area. All components of the project were underway during the 2014 field season, deploying instruments and collecting data. The active source experiment successfully set off 23 shots, recording data at about 6000 sites in late July and early August. Magnetotelluric measurements were made at 40 sites during the summer of 2014 and many rocks were collected and analyzed. The passive source seismic deployment occurred between June 16 and July 2, and involved installing 70 broadband seismometers in a ~50 km radius around MSH. The following sections detail the passive seismic deployment.

Figure 1. Proposed project map showing deployment locations of passive source seismic imaging and magnetotelluric survey (left) and active source tomography (right) in the greater Mount St. Helens area. For the active part (right), black lines are refraction profiles, each with 8 shots (red stars) and 1000 Texans. Colored areas are areal areas, each containing 1600 Texans.

June 16-June 22: Kelso, Organizing

18 people descended on an airport hangar in Kelso, WA, to begin the passive deployment. After a couple of days training on the instruments and installation procedures, buying materials and getting them ready, we headed out to begin the installations. We started out in two large groups to learn the ropes, then began to split into teams of two to three to install further sites.

Figure 2. The participants practicing seismic station setup in Kelso, WA. Photo credit: Seth Moran

Figure 2. The participants practicing seismic station setup in Kelso, WA. Photo credit: Seth Moran

A Day in the Life (by Steve Malone)

After a late night the evening before with the PIs (Principle Investigators) “strategizing” about what should next be done, it is an early morning departure. After a half hour drive one team realizes they don’t have the maps for where they are going and must return to the motel to pick them up. Another team has a flat tire on some very rough roads and must return on the spare to get it fixed…a good thing since later in the day they have another flat (different tire) so really needed that spare. Using a combination of written instructions, road maps, Forest Service maps, private timber company maps, a laptop computer with mapping software, a compass and a GPS the team finds its way to its assigned installation site which has been investigated and permitted sometime in the last couple of years. Now it is time to really get to work.

Equipment is hauled from the truck several hundred meters to the actual site, in multiple trips. Discussions, opinions and arguments issue between the two PIs in this team over exactly where the best place for the vault should be. It must be away from tall trees, in ground that can be dug but as close to bedrock as the site provides. In the meantime the hole is dug by hand by Alicia, who just graduated with a PhD and has forgotten that she should leave the digging to current grad students and participate in the PI discussions.

The actual sensor is very sensitive and must be handled with care even when its moving parts are locked for transport. Once installed on the small concrete pier in the bottom of the hole and cables attached it can be unlocked. At this point the sensor is very vulnerable to damage if moved.

In the meantime another team is working on other parts of the station installation. Many sites will be powered by solar panels. Because of the elevation and winter weather they must be installed on a mast to get them above the likely snow depth, sometimes as much as four meters deep in late winter. The mast consists of a wood post buried up to a meter with a sectional pipe bolted to it.
Once all of the heavy work is done it is time to make all the connections and test the system. A rat’s nest of wires and cables in the equipment box connects the various components. The seismometer cable comes in through a PVC pipe and power cable is protected from animals with a wire mesh screen. A seismometer control box allows for testing, unlocking and centering the seismometer even without a datalogger. The datalogger gets timing information from a specialized GPS antenna. A regular iPod with special software and cable is used to configure, initialize and test the datalogger. In one case the team forgot the iPod in the equipment box and had to drive all the way back to the site the next day to retrieve it.

Near the end, with only back filling and covering the vault and cleaning up left to do the site is a mess of tools, equipment boxes, shipping containers and water jugs. Once all of this is hauled back to the truck the site should be relatively inconspicuous.

Other Distractions

Initial sites were on the west side of MSH in a lot of timber land and we quickly found our tires weren’t up to the task. We got over ten flats split between six vehicles and thankfully no one ever got stuck, although there were at least two cases of a full flat plus another slow leak where the vehicle was able to make it back to town in time.

The World Cup was happening at the same time so some people used creative means to catch a game, although for the most part we were resigned to learn the results when we returned at night (those of us who cared, that is). Turned out sitting in a tire store waiting for a flat to be fixed was a good way to spend the morning. One team had the luck of a wet mix of concrete, which of course called for eating lunch in town (somewhere with a TV!) waiting for it to dry. Or getting a site where there was still radio reception- sitting in the car for 15 minutes to listen to the US fall to Belgium while your partner digs a hole in the blazing heat isn’t so bad, is it?

June 22-June 29: Split up- Trout Lake vs. Randle

After a week based out of the relatively civilized Kelso, WA, the group split into two smaller teams to venture east into the boonies. So the race began between Team Randle and Team Trout Lake.
In Randle, many of the sites were on Forest Service land, with much longer drive times. We began with eight people and dwindled down to five over the next week as other commitments took people away. These were long days with a lot of driving. We used slow-drying cement (the only kind available) the first day, so that delayed things a little bit, since it required returning several days later to finish the installation. Thankfully we had no flats. We were staying in a combination motel/bar/restaurant, and it was the only place we ate dinner for almost a week. It had some variety at least, and a warped pool table, jukebox, and karaoke. Internet service was limited so we had to learn to enjoy each others company instead.

Compared to Randle, Trout Lake initially sounded like a breeze. Great progress was made every day, there were two (!) places to eat at night, and teddy bears on the beds. Not everything was fun and games, however…

We have had a few field adventures, fortunately none involving flats. An iMUSH rig was high-centered on a snow drift for 15 minutes on our first day, on a road which turned out to be closed (no sign) due to snow. Fortunately another vehicle came up the road, even more fortunately it had a tow strap and was able to pull the iMUSH rig back to terra firma. Unfortunately we will not be able to reach that site until we get a few good warm days to finally melt off the snow. Another adventure involved installing a site on a steep slope with a thin soil veneer on top of bedrock that defeated all attempts at whacking it with a breaker bar. The site was installed, but the crew is less than confident about its ability to withstand snow creep (particularly the solar panel mount).Seth Moran, USGS-CVO

This site wins the prize for the worst site ever. During the siting visit a year ago Seth badly sprained his ankle. The road in had awful berms and potholes and crazy trees. The slash was crazy deep and slippery. And yet, Ben managed to haul about 160 lbs. of material through it. What a trooper.
One of the nuts on the solar panel mount was double threaded, so Tim and Roger had to saw it off. We also forgot to undo the solar panel cable before erecting the mast, so Tim got up on Ben’s shoulders to reach it. Dinner in Hood River tonight. We earned it. Whoot!Alicia Hotovec-Ellis, UW post-doc

The heat was unforgiving. It was even harder to bear when that overloaded SUV decided to fight back. The odds were against them when she blew a tire on that old dusty road. This wasn’t the first hardship they encountered, but it came at the worst time. They couldn’t chance being stranded since their comrades were hours away. The only option was to see if that old four wheeler could be put back together. The help they needed was back in town at an old service station, so the two travelers turned tail and ran. Once that old hunk of junk was fixed up, they decided to give it one more go. Although their hopes were high, their original plan was abandoned. They decided to head to the longest and most arduous site, to deploy one of the few remaining seismometers. The two weren’t out of the woods yet. They went on a few unexpected detours and were devoured by godless horse flies. After their long day was done, they headed back to that little town shadowed by the mountain.They grabbed a fulfilling meal and drank a nice strong brew…They were victorious.Gina Belair, UC-Berkeley undergrad and IRIS intern

June 29-July 2: Finishing up, Kelso

After a week further afield, the remaining participants returned to Kelso to finish up the installs on the west side of the volcano. By this time we were all seasoned pros. Combine that with fewer sites and fewer people to keep track of, and we were able to make quick work of the remaining sites and return home to celebrate the Fourth of July, until some of us returned a couple weeks later to service the instruments before the active seismic experiment began shooting.

July 15-August 5, 2014: Active Seismic Experiment

Drilling a shothole

Drilling a shothole

The iMUSH active seismic experiment was fielded from instrument centers established in the gymnasiums of public schools in the towns of Castle Rock, Woodland, and Carson, Washington. A group of 55 volunteers and four PASSCAL field technicians deployed about 2500 Texan recorders in two deployments. A dozen UNM volunteers and Nodal Seismic personnel fielded the Nodal Seismic recorders. Over 1100 instruments were hiked into the Mount St. Helens National Monument. UTEP personnel from the National Seismic Source Facility oversaw drilling and loading the 23 shotholes, and detonating the explosions. The field operations were preceded by twelve weeks of surveying and permitting. The experiment extended across the Gifford Pinchot National Forest and lands belonging to four timber companies and the State of Washington, requiring permits from fifteen public and private organizations. In addition to excellent recordings of the shots, the iMUSH active source instruments recorded dozens of local earthquakes.

Spring-Fall, 2014: Magnetotelluric Deployment

The iMUSH magnetotelluric (MT) deployments were staged from Oregon State University, in Corvallis, OR, with a forward operating base in Portland, OR. A total of 40 MT stations were completed in 2014, 97 additional stations were permitted, and 13 remain to be permitted in 2015. MT field crew participants included a USGS team led by Jarod Peacock and Lyndsay Ball, who did the major 2014 push, and an OSU team led by Myle McDonald, who installed iMUSH sites in the Fall of 2014 until the end of the field season. MT work is seasonal and is usually initiated when the ground is clear of snow and ends when snowfall becomes a significant operating concern. The 2014 field operations were limited by the number of instruments that operated with reliable firmware and the number of magnetic field seasons. The 2015 field season is about to get underway, with OSU taking up the initial installations, and USGS anticipated to resume operations later in the field season. For 2015 operations, the number of wideband MT instruments will increase from four to ten and two field crews will operate simultaneously for much of the field season.

Deploying Texans on foot around Mount St. Helens

Deploying Texans on foot around Mount St. Helens

More daily blog posts compiled by Steve Malone detailing all parts of the iMUSH experiment are on the website (imush.org). Participants in the passive seismic broadband deployment included Ken Creager, Shelley Chestler, Kelley Hall, Jiangang Han, Alicia Hotovec-Ellis, Mika Thompson, Carl Ulberg, Mark Welch (University of Washington); Geoff Abers, Zach Eilon (LDEO); Tim Clements (Cornell); Gina Belair (UC-Berkeley); Dylan Jamison (USGS-UW); Ben Alonzo, Roger Denlinger, Seth Moran (USGS-CVO); Eric Makarewicz, George Slad (PASSCAL Instrument Center). The active seismic experiment is led by Alan Levander (Rice University), the magnetotelluric component is led by Adam Schultz (Oregon State University) and Paul Bedrosian (USGS) and the petrologic studies are led by Olivier Bachmann (ETH Zurich), Tom Sisson (USGS) and Mike Clynne (USGS). iMUSH is funded by NSF-GeoPRISMS, NSF-Earthscope with substantial in-kind support from the USGS. Broadband seismometers and support was provided by IRIS-PASSCAL.

Newsletter_Spring2015_iMUSHgroupCreager

“Report from the Field” was designed to inform the community of real-time, exciting GeoPRISMS -related research. Through this report, the authors expose the excitement, trials, and opportunities to conduct fieldwork, as well as the challenges they may have experienced by deploying research activities in unique geological settings. If you would like to contribute to this series and share your experience on the field, please contact the GeoPRISMS Office at info@geoprisms.nineplanetsllc.com. This opportunity is open to anyone engaged in GeoPRISMS research, from senior researchers to undergraduate students.
We hope to hear from you!

Reference information
iMUSH: Imaging Magma Under St. Helens, Ulberg C. and members of the iMUSH Team

GeoPRISMS Newsletter, Issue No. 34, Spring 2015. Retrieved from http://geoprisms.nineplanetsllc.com

Cascadia Initiative Workshop Update


Portland, Oregon, October 15-16, 2010

Jeff McGuire1, Doug Toomey2, Chris Goldfinger3, Susan Schwartz4, Richard Allen5

1WHOI; 2University of Oregon; 3Oregon State University; 4UC Santa Cruz; 5UC Berkeley

PBO GPS stations upgraded as part of the Cascadia Initiative (black triangles) and broadband seismometers (circles) expected to operate in the Cascadia Region in various time windows between 2011 and 2015. For a detailed discussion of the different seismometer experiments (color-coded) and the schedule of their deployments, please see the full workshop report.

PBO GPS stations upgraded as part of the Cascadia Initiative (black triangles) and broadband seismometers (circles) expected to operate in the Cascadia Region in various time windows between 2011 and 2015. For a detailed discussion of the different seismometer experiments (color-coded) and the schedule of their deployments, please see the full workshop report.

As part of the 2009 Stimulus or ARRA (American Recovery and Reinvestment Act) spending, NSF’s Earth Sciences (EAR) and Ocean Sciences (OCE) divisions each received $5M in facility-related investment. The funds were targeted toward the creation of an Amphibious Array Facility (AAF) to support EarthScope and MARGINS science objectives. The initial emphasis and deployment site was onshore/offshore studies of the Cascadia margin, with an expectation that the facility would later move to other locations. Thus, the Cascadia Initiative (CI) is an onshore/offshore seismic and geodetic experiment that takes advantage of the Amphibious Array to study questions ranging from megathrust earthquakes, to volcanic arc structure, to the formation, deformation and hydration of the Juan De Fuca and Gorda pPlates. The Initiative was featured in Vice President Biden’s list of “100 Recovery Act Projects that are Changing America” under the heading “Research to Avert Disaster: Understanding Earthquakes in the Pacific Northwest – Oregon, Washington, Northern California”. In October 2010, we convened an open community workshop that produced a series of recommendations to maximize the scientific return of the CI as well asand to develop deployment plans for the offshore component of the experiment. We summarize some of the main points of the full workshop report here.

The science objectives of the CI are wide-ranging. The new instrumentation will enable: real-time, high-rate GPS data to be used both for studying large earthquakes in the region and potentially for real-time seismic and volcanic hazard mitigation; continued monitoring of non-volcanic tremor along the entire subduction zone; imaging of the physical properties of the (offshore) megathrust properties; and studies of the formation, evolution, deformation and hydration of the incoming Juan de Fuca and Gorda plates as it they moves from ridge to trench. This diverse set of objectives are all components of understanding the overall subduction zone system and require an array that provides high quality data that crosses the shoreline and encompasses relevant plate boundaries.

The ARRA funded upgrades to 232 Cascadia GPS stations that are part of the Plate Boundary Observatory, that are being carried out by UNAVCO (Figure 1). The improvements include switching from daily downloads to continuous, real-time streaming of data from daily downloads, and increasing the rate of sampling from 30-second to 1-second epochs. The majority of these upgrades have already been completed;, the project is on schedule and on budget., and the remainder of the PBO stations will be completed by summer of 2011.

The onshore seismic component of the AAF consists of 27 EarthScope/USArray/Transportable Array station sites that have been deployed to complement the existing distribution of broadband stations in Cascadia, (Figure 1). Where possible and appropriate, some of the 27 sites are reoccupying the original sites of the Transportable Array in the region. In other cases, new sites were have been identified to complement existing stations and/or when if the original site was is not available. All 27 sites have a broadband velocity sensor and a strong-motion accelerometer and the deployments were completed in the summer of 2010 (Figure 2). All are operational with data streaming in near-real time to the IRIS Data Management Center (DMC), and will operate until at least September 2013. The data are archived at the IRIS Data Management CenterDMC. Stations report their data under the TA network code, and use the standard TA station naming convention. In addition, the Virtual Network Definition (VND) capability at the DMC provides a simple means to access these data. The virtual network “_CASCADIA” will provide access to the 27 TA stations plus 47 other broadband stations in the area, while the “_CASCADIA-TA” VND provides access to the 27 TA Cascadia stations.

The CI funded the construction of a total of 60 Ocean Bottom Seismometers (OBSs) by the three Institutional Instrument Contributors (IICs) of the National Ocean Bottom Seismometer Instrumentation Pool (OBSIP). The IICS group at Lamont-Doherty Earth Observatory (LDEO) will build 30 OBSs, while the groups at the Scripps Institute of Oceanography (SIO) and the Woods Hole Oceanographic Institution (WHOI) will build 15 each. All 60 OBSs will be equipped with Nanometrics Trillium Compact seismometers. In addition to the seismometers, the SIO and WHOI OBSs will be equipped with Differential Pressure Gauges (DPGs) while the LDEO OBSs will carry Absolute Pressure Gauges (APGs). Twenty of the LDEO OBSs will be installed in trawl-resistant enclosures and will be available for deployments in water depths extending from the shelf down to 1,000 m. These 20 OBSs will be deployed via the ship’s wire and recovered using a Remotely-Operated Vehicle (ROV). These instruments will not be deployable in water depths greater than 1,000 m. The fifteen SIO OBSs will also be installed in trawl-resistant enclosures, and are deployable at depths extending from the shelf down to 6,000 m. The WHOI OBSs will not be deployable in depths shallower than 1000 m. All 60 instruments will be equipped with 12-month battery packs.

The OBSs will be utilized in four one-year long deployments. These experiments will provide an offshore extension of the EarthSscope Transportable Array (≈70 km spacing) as well as 3 dense experiments focused on either imaging various properties of the thrust interface and forearc or recording local seismicity (Figure 1). The OBS deployment geometry complements the cabled observatories of NEPTUNE Canada and the Regional Scale Nodes of the Ocean Observatory Initiative as well as funded, PI-driven OBS experiments designed to study deformation near the Blanco Transform and within the Gorda Plate. The proposed deployment plans are described in detail in the workshop report.

Figure 2. Installation of station N02D at Trinity Center in northern California in the fall of 2009

Figure 2. Installation of station N02D at Trinity Center in northern California in the fall of 2009

A team of PIs will lead expeditions to deploy and recover CI OBSs and to develop Education and Outreach modules. The team is being organized by Doug Toomey and includes Richard Allen, John Collins, Bob Dziak, Emilie Hooft, Dean Livelybrooks, Jeff McGuire, Susan Schwartz, Maya Tolstoy, Anne Trehu and William Wilcock. The PI team is knowledgeable about the science and operational objectives of the CI, includes individuals with chief scientist experience, as well as onessome who have not yet been to sea, and comprises representatives from both the EAR and OCE communities. It is anticipated that there will be berths for students, post-docs and other scientists to participate in either deployment or recovery legs, thus providing the seismological community with opportunities to gain valuable experience in planning and carrying out an OBS experiment. Funding and ship time for the deployments and recoveries of OBS will be supported primarily by the Ocean Sciences Division of NSF.

The CI has a finite duration with the intention that both the onshore and offshore components of the AAF will move to other locations following the completion of the CI. The community plan that resultinged from the October workshop requiresa four 4-years of onshore/offshore deployments in Cascadia, which will begin in the summer of 2011. The four4 one-year OBS deployments in the region would last until the summer/fall 2015 at which point the AAF could move to a new location, or could remain in Cascadia. The October workshop recommended that during the deploymentfour years, smaller workshops should be held to evaluate data quality, present results from initial analyses, and make adjustments to the deployment plan if necessary. A process is also needed to decide where the AAF should be deployed following the initial 4-year deployment in Cascadia. In the context of the ongoing EarthScope initiative, possible locations include the East Coast, the Gulf of Mexico, and Alaska. However, the AAF could also move to other locations, and could also or remain in Cascadia. A community workshop in 2014 was therefore proposed as a venue to decide on the next deployment of the AAF.

 Reference information
Cascadia Initiative Workshop Update, McGuire J. et al;

GeoPRISMS Newsletter, Issue No. 26, Spring 2011. Retrieved from http://geoprisms.nineplanetsllc.com

Bathymetric Surveys of the Cascadia Subduction Zone in Support of the Cascadia Initiative OBS Array Deployment


Chris Goldfinger, Oregon State University


As part of the 2009 Stimulus or ARRA (American Recovery and Reinvestment Act) spending, NSF’s Earth Sciences (EAR) and Ocean Sciences (OCE) divisions each received $5M in facility-related investment. The funds were targeted toward the creation of an Amphibious Array Facility to support EarthScope and MARGINS (now GeoPRISMS) science objectives. The initial emphasis and deployment site was onshore/offshore studies of the Cascadia margin, with an expectation that the facility would later move to other locations.

At the October 2010 CEIT OBS workshop held in Portland OR, a number or practical issues were raised in conjunction with this ambitious OBS deployment. One of these was the issue of good bathymetric data needed for good siting and safety of the instruments along the Cascadia margin. In addition, Cascadia is also now the site of the main components of the Ocean Observing Initiative (OOI) and Neptune Canada, the world’s premier cabled observatory systems, and these will be in operation collecting real-time data from a wide spectrum of sensors for decades to come. Cascadia has also now been chosen and a Focus Site for the NSF GeoPRISMS program, which will focus attention on Cascadia earthquake tectonics for the next decade.

Figure 1. “Before” Bathymetric coverage of the Washington-Vancouver Island margin. Translucent overlay shows existing multibeam coverage from most known cruises mostly collected by OSU and restricted until recently. Remaining areas are only covered by sparse NOS soundings. Yellow dots are approximate OBS deployment locations for year one. Some of these were re-located to better sites in terms of trawl protection and topography after the 2011 cruise data were processed.

Figure 1. “Before” Bathymetric coverage of the Washington-Vancouver Island margin. Translucent overlay shows existing multibeam coverage from most known cruises mostly collected by OSU and restricted until recently. Remaining areas are only covered by sparse NOS soundings. Yellow dots are approximate OBS deployment locations for year one. Some of these were re-located to better sites in terms of trawl protection and topography after the 2011 cruise data were processed.

Bathymetric data for the OBS deployments

Good bathymetric data are essential for siting OBS station locations and ensuring the best chance of the instruments settling to the bottom in relatively smooth flat areas with a good chance of good recording fidelity. Equally important is to deploy instruments in areas where the topographic, structural, and hydrologic context is reasonably well understood, so that a maximum number of instruments will be recovered from each deployment. Some of the CI deployed instruments will be located on the abyssal plain of the Juan de Fuca plate, and are relatively safe from local geohazards. However, this initiative specifically addresses the Cascadia subduction boundary, and thus most of the instrument deployments are on the continental margin of this very dynamic plate boundary (Figure 1). Because many of the deployments span a number of active canyon systems and seismically active areas, good bathymetric data are also required to prevent a number of instruments from being swept into channels and canyons and lost or damaged during the deployment.

Current state of Cascadia bathymetric coverage

In the NE pacific region, the Cascadia margin and Cascadia basin has spotty coverage of modern multibeam data. 1980’s vintage EEZ survey data cover Oregon and Northern California from ≈600 m to the abyssal plain out to 1260W. This includes a major survey of the Gorda Plate done during an extended sea trial of the then new AGOR Ronald H. Brown. Much of the ridge system at The Gorda, Juan de Fuca and Explorer ridges and Blanco, Mendocino and the Nootka faults have multibeam data collected over the years during NSF and NOAA sponsored work. The EEZ data were collected in the 1980’s with the original 90 degree Seabeam Classic, now quite antiquated, but adequate for regional context. There are also very large gaps in even these data. The EEZ data collected in the 1980s off Washington was first “classified” by the Navy due to their submarine activity there, and then subsequently “lost” while in storage. Consequently, comprehensive coverage of the Washington margin has not been available. Through the 90’s and early 2000’s, OSU collected data on the WA margin in support of paleoseismic and other cruises, and there were also several cruises of the German vessel Sonne. These data were collected in mission specific areas, and with a variety of systems, and therefore not ideal for regional coverage. Releases of these data were for a time also restricted by the Navy, but since 2008 the data are no longer restricted, nor is collection of new data by academic and Government agencies. These older data were collected with now antiquated systems, including the original Krupp Atlas Hydrosweep and SeaBeam classic and SeaBeam 2000 systems. Shallow data, less than ≈600 m, are even more sparse. Some of the shallow banks in Oregon have been mapped with high resolution systems, and several other NOAA, NSF, MMS and state supported projects have mapped small portions of the shelf, but an estimated 75% of waters shallower than 600m remain unmapped.

Figure 2. “After” Bathymetric coverage of the Washington-Vancouver Island margin following the June 2011 CEIT cruise with modified OBS locations. New and old data have been assembled in CARIS bathymetric database software.

Figure 2. “After” Bathymetric coverage of the Washington-Vancouver Island margin following the June 2011 CEIT cruise with modified OBS locations. New and old data have been assembled in CARIS bathymetric database software.

The need for new bathymetric data

At a minimum, small patches of bathymetric data are desirable for site location of Cascadia margin OBS sites, where even the location of major canyon systems is only approximately known (Washington and Vancouver Island). Minimal patch size should be at least a few km2 in order to ensure safe and effective deployments. A better approach however would be to survey contiguous larger areas that serve to aid in deployments, but also to establish the structural context of the deployments and of the Cascadia margin, which was the approach supported for this project.
Beyond the CIET OBS deployment, this project took the opportunity to, for the first time, obtain a nearly complete image of the Cascadia Subduction Zone that will make significant steps toward filling gaps in our knowledge of the regional tectonics of the Cascadia margin. The project is supportive of the goals of the CIET OBS array, the OOI and GeoPRISMS objectives, and also directly addresses the issue of regional earthquake hazards. The ideal vessel for this purpose was the R/V Thomas Thompson, with its newly upgraded Kongsberg EM-302 multibeam system, with the best resolution for the ≈1000-2500 m target depth range for much of the survey. This vessel, working at survey speeds can also collect concurrent 3.5 kHz Chirp sub-bottom data during the survey work, which is also useful for deployment assessment and many other purposes.

In planning the cruise, we prioritized the most hazardous sites on the margin, and also prioritized completion of margin coverage that is useful for OOI, GeoPRISMS, and regional context. Most mid-plate sites are relatively near existing coverage, but will be surveyed on future cruises if possible before deployment (Figure 1).

The priority survey area on the Washington margin is shown in Figure 1 with existing multibeam coverage along with approximate OBS site locations. Final site choices have and will take advantage of less hazardous sites than shown in Figure 1, as well as trawl closures and the existing Olympic Coast Marine Sanctuary to avoid natural and anthropogenic hazards.

Figure 2 shows the “after” picture of the Washington-Vancouver Island margin. Older bathymetric data have been combined with new data in CARIS in this image. Ongoing work will attempt to reconcile the several generations of sonars used, tide, velocity and other corrections as well as to edit and improve the older data where possible to produce a final surface integrated with existing soundings where multibeam data are still lacking. This will also be done for the Oregon-Northern California parts of the margin where less extensive new data were also collected to fill smaller gaps. A final compilation of the Cascadia margin will be made available to the community when complete in 2012

 Reference information
Bathymetric Surveys of the Cascadia Subduction Zone in Support of the Cascadia Initiative OBS Array Deployment, Goldfinger C.;

GeoPRISMS Newsletter, Issue No. 27, Fall 2011. Retrieved from http://geoprisms.nineplanetsllc.com

Status of the Ocean Bottom Seismology Component of the Cascadia Initiative


By the Cascadia Initiative Expedition Team (CIET)

Figure 1. Oblique shaded relief map showing the Cascadia Array.::The four-year deployments plan of the OBS array, cabled networks associated with NEPTUNE Canada and OOI, earthquake distributions, oceanic spreading centers, and transform faults are all shown.

Figure 1. Oblique shaded relief map showing the Cascadia Array.::The four-year deployments plan of the OBS array, cabled networks associated with NEPTUNE Canada and OOI, earthquake distributions, oceanic spreading centers, and transform faults are all shown.

The Cascadia Initiative (CI) is an onshore/offshore seismic and geodetic experiment that takes advantage of an amphibious array to study questions ranging from megathrust earthquakes to volcanic arc structure to the formation, deformation and hydration of the Juan de Fuca and Gorda plates. This diverse set of objectives are all components of understanding the overall subduction zone system and require an array that provides high quality data that crosses the shoreline and encompasses relevant plate boundaries. An article in the previous GeoPRISMS Newsletter (Spring 2011, issue No. 26) described CI scientific objectives, the outcome of an open community workshop held in October 2010 to develop deployment plans for the offshore component of the experiment, and formation of the Cascadia Initiative Expedition Team (CIET). This article provides an update of CIET activities including the first year of CI OBS deployments (summer 2011) and related Education and Outreach (E&O) efforts.

Over its planned 4-year data acquisition period, the offshore portion of the Cascadia Initiative will involve the deployment and recovery of ~280 OBSs at ~160 different sites and a total of about 14 cruises. Each OBS deployment site requires careful evaluation to ensure that the notional deployment plans developed at the 2010 CI workshop take into consideration local bathymetry, trawling hazards and the presence of fragile ecosystems. The CIET incorporates this information into a detailed deployment plan that includes a prioritized deployment schedule. It is anticipated that the adjustments to most deployment sites will be minor (e.g., small changes in drop coordinates to avoid geological hazards or take advantage of preexisting multibeam bathymetry). However, practical considerations may require some larger changes to the notional plans developed at the 2010 CI workshop in which case the CIET has developed a procedure for revisions, as described on the CIET web site. Scientific oversight is required at sea to ensure that operation decisions driven by instrument failures, bad weather or other factors are guided by the scientific objectives of the experiment. A detailed cruise report will be produced for each cruise to fully document the experiment.

The CIET has been actively discussing and planning the 2011 deployments for several months. Since we are geographically distributed and our schedules are often conflicting we use a variety of communication tools. These include regular emails, a CIET web site that provides wiki capabilities, and bi-weekly conference calls with minutes and action items posted to the CIET site. The CIET website is currently used by the group for communication, discussion and limited data exchange. Much of the website content is viewable by the community. Looking toward the future, the CIET site will also be used for education and outreach, communication with the scientific community, and development and delivery of metadata pertaining to OBS deployments and recoveries (e.g., cruise reports). The CIET will hold its first face-to-face meeting this fall in Seattle on September 13 and 14.

Figure 2: Year 1 Deployment Plan.::Red circles denote the reference array. Yellow circles denote the Regional Array. Yellow squares denote the Focused Array. Yellow diamonds denote the densified coverage of the forearc enabled by requesting 10 additional instruments from the OBSIP pool. Black circles denote on land broadband seismometers. Red squares denote the NEPTUNE Canada seismometers. Blue lines denote slap depth contours (every 10 km). The 1000 m bathymetry contour is shown in bold. See 2010 CI Workshop Report for further descriptions.

Figure 2: Year 1 Deployment Plan.::Red circles denote the reference array. Yellow circles denote the Regional Array. Yellow squares denote the Focused Array. Yellow diamonds denote the densified coverage of the forearc enabled by requesting 10 additional instruments from the OBSIP pool. Black circles denote on land broadband seismometers. Red squares denote the NEPTUNE Canada seismometers. Blue lines denote slap depth contours (every 10 km). The 1000 m bathymetry contour is shown in bold. See 2010 CI Workshop Report for further descriptions.

2011 FIELD SEASON

In accord with the deployment plan developed at the CI Workshop, the CIET proposed to NSF to deploy 70 OBSs during the 2011 field season according to the Year 1 plan (Fig 1). All of the OBS deployments will be done from the R/V Wecoma. Given the limited deck space on this ship, 3 cruises will be required to deploy all 70 OBS. The cruise schedule and chief scientists for 2011 operations are as follows:

  • Leg 1, July 23 – August 2, 2011. Chief Scientists: Maya Tolstoy (LDEO), Anne Trehu (OSU)
  • Leg 2, October 15-29, 2011. Chief Scientists: Robert Dziak (OSU), Del Bohnenstiehl (NCSU)
  • Leg 3, October 30 – November 12, 2011. Chief Scientists: John Collins (WHOI), Emilie Hooft (UO)

CI Leg 1 – W1107A: The first OBS deployment cruise for the Cascadia Initiative took place between July 23rd and August 2nd 2011 aboard the Research Vessel Wecoma. The cruise deployed 15 of the newly designed LDEO-OBSIP Trawl Resistant Mounted OBSs or TRM-OBSs; the original goal was to deploy 20 TRM-OBSs, however, 5 were not fully built. These instruments are designed to provide a shield around the seismometer that should both reduce current noise and provide some protection from the bottom trawl fishing that occurs along the Cascadia margin. The instruments were therefore targeted for deployment at shallow sites (<1000 m) where trawling and currents are most likely to be an issue. The TRM-OBSs contain a Trillium compact seismometer as well as a Paros Instruments Absolute Pressure Gauge (APG), which should be useful in reducing long period noise and in measuring seafloor deformation. The TRM-OBSs will record continuously at 125 samples/sec until they are recovered in early summer 2012 using either an attached pop-up buoy system (instruments < 200 m water depth) or a Remotely Operated Vehicle (ROV).

The TRM-OBSs were largely used to fill the sites of the northern focused array that were < 1000 m depth because of the advantage of having a tight array of APGs. The CIET and the Amphibious Array Steering Committee (AASC) provided a prioritized list of sites prior to the cruise to enable the co-chief scientists to adapt the deployment pattern as necessary while at sea. Individual site locations were adjusted based on feedback from the chair of the Oregon Fisherman’s Cable Committee (OFCC), and different iterations of site locations were identified with the letters B, C and D appended to the site name and number. It is important for both the instruments and the safety of the fishing community and their equipment that regularly fished sites be avoided.
One site was inadvertently deployed at a heavily fished site, and attempts to recover it using the attached pop-up buoy failed. The instrument ended up upside down, which was a serious hazard to the fishing community. This instrument was recovered on August 14th by John Delaney and Deborah Kelley (UW), who generously took time out of their Visions11 cruise to pick up the TRM-OBS using ROV Ropos aboard the R/V Thompson. A video of the recovery can be seen online.

Two community college students were able to join the cruise as part of a summer enrichment program designed by Dean Livelybrooks (Univ. of Oregon) to introduce community college students to science. A PhD graduate student and an undergraduate IRIS summer intern also participated. Having a full complement of watchstanders and 2 co-PIs enabled us to operate research around the clock. While the OBS team slept, 4 & 12 kHz surveys were conducted to image bubbles in the water column from cold seeps in the region.

This cruise was the first full deployment of this new OBS design, and as such, much was learned. You can read a detailed account of the cruise activities in the cruise report which can be found at the CIET website. We are grateful to the Captain and Crew of the R/V Wecoma and the science party, who all worked extremely hard to make the cruise as successful as it was.

Figure 3. An LDEO-TRM OBS being deployed aboard the R/V Wecoma in July 2011.::The white octagonal frame is designed to sink a few inches into the sediment and shield the seismometer from current noise and trawl fishing.

Figure 3. An LDEO-TRM OBS being deployed aboard the R/V Wecoma in July 2011.::The white octagonal frame is designed to sink a few inches into the sediment and shield the seismometer from current noise and trawl fishing.

CI Leg 2: The second CI leg will take place from October 15-29, 2011 aboard the R/V Wecoma, leaving from and returning to Newport, OR. This expedition will deploy 25 OBSs, 15 from SIO and 10 from LDEO. The fifteen SIO OBSs will also be installed in trawl-resistant enclosures and are equipped with Differential Pressure Gauges (DPGs); these instruments are deployable at depths extending from the shelf down to 6,000 m. The remaining ten LDEO instruments are not in trawl resistant enclosures and so must be deployed below 1,000 m; they do carry APGs.

CI Leg 3: The third CI leg will take place from October 30 – November 12, 2011 aboard the R/V Wecoma, leaving from and returning to Newport, OR. This expedition will deploy 25 OBSs, 15 from WHOI and 10 from the OBSIP pool. All these OBSs are not trawl resistant and will be deployed at depths deeper than 1000 m; they carry DPGs.

CI EDUCATION AND OUTREACH

The Cascadia Initiative Education and Outreach (E&O) program is developing two opportunities during its first year, led by Dean Livelybrooks (UO):

1. The ‘CC@sea’ project supports community college (‘CC’) student participation in OBS deployment, retrieval and pre-cruise and follow-up outreach activities in CCs, high schools and the community. CC@sea> leverages another NSF (STEP) program, Undergraduate Catalytic Outreach and Research Experiences (UCORE) that has built strong ties with six Oregon community colleges. Two community college (‘CC’) students participated in the 23-July to 2-August OBS deployment cruise of the R/V Wecoma. The Fellows stood watch, helped with instrument deployment and made movies of all aspects of sea-going research. Dean Livelybrooks also participated in this first sea-going leg to initiate and supervise these activities. The goal of the CC@sea> program is to attract students from diverse, non-traditional backgrounds to a four-year degree in physical sciences and that these students transfer their experiences to the community and their peers. CC@sea> personnel made a very entertaining and informative video suitable for other community college and high school students during the first deployment leg, which will be shown in science classes at participating UCORE campuses and elsewhere.

2. A fall planning, teacher professional development workshop for a seismometers @ schools (S@S) program, where teachers and students, with assistance, install, monitor, and interpret seismograms and characterize shaking at school sites to advocate for seismic retrofit upgrades in older schools in the Pacific NW.

Figure 4. Final deployment locations for W1107A cruise

Figure 4. Final deployment locations for W1107A cruise

CIET Membership:

Doug Toomey (Team Leader, University of Oregon), Richard Allen (University of California, Berkeley), John Collins (Woods Hole Oceanographic Institution), Bob Dziak (OSU/NOAA, Newport, OR) Emilie Hooft (University of Oregon), Dean Livelybrooks (University of Oregon) Jeff McGuire (Woods Hole Oceanographic Institution), Susan Schwartz (University of California, Santa Cruz), Maya Tolstoy (Lamont Doherty Earth Observatory), Anne Trehu (Oregon State University), William Wilcock (University of Washington)

 Reference information
Status of the Ocean Bottom Seismology Component of the Cascadia Initiative, the CIET Team (Toomey et al);

GeoPRISMS Newsletter, Issue No. 27, Fall 2011. Retrieved from http://geoprisms.nineplanetsllc.com

GeoPRISMS – EarthScope Science Workshop for Cascadia Report


Portland, Oregon, April 4-6 2012

Workshop Conveners: Geoff Abers1, Ramon Arrowsmith2, Joan Gomberg3, Andrew Goodliffe4, Adam Kent5, Katie Kelley6, Harvey Kelsey7, Julia Morgan8, Josh Roering9, Anne Trehu10, Kelin Wang11

1Lamont-Doherty Earth Observatory; 2Arizona State University; 3US Geological Survey; 4University of Alabama; 5Oregon State University; 6University of Rhode Island; 7Humboldt State University; 8Rice University; 9University of Oregon; 10Oregon State University; 11Pacific Geoscience Center

Figure 1. Bathymetry & topography of the Cascadia margin and associated tectonic elements.  Significant arc volcanoes indicated by orange triangles.  Map generated using GeoMapApp.

Figure 1. Bathymetry & topography of the Cascadia margin and associated tectonic elements. Significant arc volcanoes indicated by orange triangles. Map generated using GeoMapApp.

Background and Motivations

GeoPRISMS and EarthScope co-sponsored this science workshop on Cascadia, held April 4-6, 2012 at the World Trade Center in Portland, OR, as a joint effort to foster communication and collaboration among researchers with diverse interests in Cascadia. The broader goal was to inform and revise guiding documents for both communities. The following is a synopsis of the workshop, which is summarized more completely in a workshop report which can be found on-line at http://www.geoprisms.nineplanetsllc.com/past-meetings/207-cascadia-apr2012.html.

The Cascadia subduction zone, which cuts through three US states and western Canada (Figure 1), is the only region of the lower 48 states that is capable of producing a Mw 9 earthquake and has the greatest potential for volcanic eruptions in the conterminous US. A trove of new geological, geodynamic, and geophysical data has recently been collected and more will be forthcoming in the next several years, thanks in part to NSF investments in EarthScope and the onshore/offshore ARRA-funded Amphibious Array Facility (AAF) of the Cascadia Initiative (CI) [See GeoPRISMS Newsletter, Issue 27 for more information]. The Cascadia margin was also chosen as a Primary Site of the NSF GeoPRISMS program during the Subduction Cycles and Deformation (SCD) Initiative Implementation Workshop in 2011, and is thus recognized as a focal point of interest to a broad base of scientific communities. With so many other onshore and offshore research efforts in process or planning stages, the time was right to hold a science workshop to build synergies among communities, disciplines, and agencies with scientific interests in the area. Ongoing/future scientific efforts in Cascadia will benefit greatly from communication and coordination among these diverse groups.

The workshop took as its starting point the Cascadia SCD portion of the GeoPRISMS Science and Implementation Plans (http://www.geoprisms.nineplanetsllc.com/science-plan.html) and the EarthScope Science Plan. The primary goals of the workshop were to: (i) to clarify common research objectives within Cascadia; (ii) to address the range of interacting tectonic, magmatic, and surficial processes acting along the convergent margin; and (iii) to update implementation plans and timelines for GeoPRISMS and EarthScope research, considering available resources and infrastructure. A key additional goal of the workshop was to tap a broad cross-section of researchers working in Cascadia, or interested in future opportunities, and to foster interaction and discussions leading to new collaborations and understanding. This specifically included entraining early-career scientists (students, postdocs, and new faculty) interested in furthering Cascadia science.

Overview

The workshop was attended by nearly 180 participants (Figure 2), including ~60 graduate students and post-docs, for two days of talks and discussion in Portland, OR. The workshop aimed to provide a platform for review and synthesis of the current state of Cascadia science, involving a wide range of topics from tectonics to geophysics/geochemistry to sedimentation and beyond, and an open forum for discussion of the future directions of scientific research in Cascadia. A student symposium took place on the day before the workshop, introducing graduate students and post-docs to the Cascadia system through a series of talks and a regional field trip. The 2-day workshop was organized into a series of broad plenary talks to provide an overview of the Cascadia subduction system, interleaved with topical break-out sessions, short presentations on hot-topic science, poster sessions, and plenary discussions.

Figure 2.  Participants at the GeoPRISMS-EarthScope Cascadia Workshop in Portland, April 2012.

Figure 2. Participants at the GeoPRISMS-EarthScope Cascadia Workshop in Portland, April 2012.

The first day opened with plenary presentations on the tectonics, volcanism, faulting, and deep structure of the Cascadia subduction system, followed by updates on the current major projects ongoing in the Cascadia region. A set of evening discussion sessions (Special Interest Groups, or SIGs), focused on these major projects, providing opportunities for informal discussions of the details of each project, and helped define pathways for future research to link in to these efforts. The second day of the workshop opened with a plenary session on sedimentary processes in Cascadia, followed by two sets of special interest group (SIG) break-out discussions targeted at communities with interests in particular scientific questions or processes relevant to Cascadia. These discussions were followed by shorter plenary presentations on the geohazards specific to the Cascadia margin, and reports by each of the breakout groups summarizing the main discussion points in each session. The workshop wrapped up with a presentation from the student participants in the workshop, and an open plenary discussion outlining a “roadmap” to the future of Cascadia science.

For the GeoPRISMS community, one of the key objectives of the Cascadia workshop was to obtain input to refine the directions of GeoPRISMS research in Cascadia. In particular, the outcomes of the breakout and plenary discussions at the workshop will be incorporated into an updated version of the GeoPRISMS Implementation Plan (IP) for the Cascadia Primary Site (e.g., /science-plan.html). This document provides guidance to principal investigators interested in submitting proposals for funding under the NSF GeoPRISMS Program. Although proposals for research in Cascadia have been accepted under the GeoPRISMS solicitation since 2010, input from the community to clarify the research priorities for GeoPRISMS in Cascadia has been limited, with a strong emphasis on projects linked to the Cascadia Initiative.

Thus, a main goal of this workshop was to open an interdisciplinary dialog that would enable an integrated view of the Cascadia subduction zone, to solicit and incorporate feedback on science implementation in Cascadia from a broad-based community, and to provide focus and guidance for subsequent GeoPRISMS proposal solicitations.

For the EarthScope community, this workshop provided an integrative scientific dialogue building on the transformative observations from its augmented geodetic, magnetotelluric, and seismological facilities in Cascadia. Numerous science targets identified in the EarthScope Science Plan were illuminated in the presentations and discussions from the workshop. Initial research results from jointly NSF-funded EarthScope and GeoPRISMS projects were presented and momentum for additional joint proposals was evident and encouraged. In addition, IRIS and UNAVCO as the respective managers of the seismological and geodetic facilities of EarthScope are currently developing proposals for 2013-2018 operations and maintenance. The community discussions about science targets, priorities, and opportunities for coordination with other programs such as GeoPRISMS provide essential fodder for these necessarily integrative proposals.

Student Symposium

An important aspect of any scientific meeting is the engagement, preparation, and inspiration of the next generation of scientists and leaders. The student symposium, held before the workshop and attended by thirty-three students and two postdocs from thirteen universities, brought together representatives from this vital demographic, coordinated by Andrew Goodliffe (University of Alabama) with help from the GeoPRISMS Office and several workshop conveners and participants. Introductions to the GeoPRISMS and EarthScope Programs were followed by overviews of the geology and geophysics of the Cascadia region. The students and postdocs then took over the stage, giving one-slide descriptions of their research. Those presenting posters had an opportunity to highlight the work that they would be presenting later in the meeting.

In the afternoon, Ray Wells (USGS) and Ian Madin (Oregon Department of Geology and Mineral Industries) led a fieldtrip through the Portland metropolitan area. Participants got to see a spectacular Columbia River Basalt outcrop, evidence of mass wasting, a panorama of the Portland Basin and rocks form the Boring volcanic field flow. The field trip ended at the Zoo station of the Portland MAX light rail system where a spectacular core (recovered during the construction of the 3-mile-long tunnel) is displayed.

In the evening, following the icebreaker for the Cascadia workshop, symposium participants participated in a lively group dinner at Kell’s Irish Pub. Several workshop scientists joined the group and shared insights about their career path and the GeoPRISMS/EarthScope programs.

Workshop Program

The workshop was structured around several key topics:
  • Cascadia Crustal Evolution and Deformation
  • Earthquakes and Other Faulting Processes
  • Large-scale and Deep Processes
  • Sediment Transport, Accretion, and Subduction
Figure 3. Ray Wells demonstrates present-day Cascadia plate motions.

Figure 3. Ray Wells demonstrates present-day Cascadia plate motions.

Each topic was provided several keynote presentations, all of which can be found on the meeting website. These presentations led to stimulating plenary and break-out discussions.
The Cascadia Crustal Evolution and Deformation session highlighted the geological evolution of the Cascadia margin (Ray Wells, Figure 3), the pre-Quaternary magmatic history of Cascadia (Anita Grunder) and the history of recent magmatism and volcanism (Kathy Cashman).

On the topic of Earthquakes and Other Faulting Processes, a primary focus of both EarthScope and GeoPRISMS research at Cascadia, three different perspectives were offered, including new observations from the recent Tohoku earthquake and ongoing and planned work in Japan (Shuichi Kodaira), paleoseismic studies of past megathrust earthquakes along the Cascadia margin (Rob Witter), and recent seismicity and tremor activity along the Cascadia margin (Ken Creager).

The session on Large-scale and Deep Processes focused on the large-scale processes that control subduction system dynamics, with an emphasis on those processes that occur deep with the subduction system, such as the thermal-petrologic-fluid flow structure and dynamics of subduction zones (Ikuko Wada), the geodynamic framework of the Pacific Northwest, in light of new data obtained from seismic tomography and other sources (Gene Humphreys), and magma generation in Cascadia, in particular, reasons for the anomalously hydrous magmas in this hot system (Tom Sisson).

A session on Sediment Transport, Accretion, and Subduction addressed the Cascadia forearc as a setting for the transport of sediment from the Coast Ranges through the estuaries offshore to the accretionary prism and the abyssal plain, with topics ranging from the driving forces for erosion initiated through wedge dynamics (Mark Brandon), to deformation of sediment in the offshore accretionary wedge (Lisa McNeill) to the mechanisms and processes of delivery of sediment to the continental slope and abyssal plain by turbidites (David Piper).

Figure 4. Attendees participated in animated conversations during poster sessions.

Figure 4. Attendees participated in animated conversations during poster sessions.

Workshop attendees also participated in stimulating poster sessions addressing a wide range of Cascadia and related research topics (Figure 4). Poster-viewing time was provided during both days of the meeting schedule, and posters were well attended during these times, as well as at other times during the meeting.

Volunteers served as judges for the excellent posters that many of the students and postdocs presented. Although all of the presentations were of high quality, three posters rose to the top. These were: Allison Koleszar (postdoc, Oregon State University); Jason Patton (Ph.D. candidate, Oregon State University); and Wanda Vargas (M.S. student, Cornell University). Each student received a copy of the book “In Search of Ancient Oregon: A Geological and Natural History”, by Ellen Morris Bishop.

Special Interest Group (SIGs) discussions during the workshop to discuss scientific topics, targets, and research approaches relating to specific processes or approaches, for example, Deep Subduction Zone Structure, Megathrust Structure and Processes, Outer Forearc Structure and Segmentation, Geodetic Processes, Magmatism and Volcanic Processes, Volatile Processes and Cycles, and Sedimentary Processes. Each session was asked to address the following questions: (a) What are the key exciting scientific questions that can be addressed in Cascadia? (b) What infrastructure exists in Cascadia research to address them? (c) What knowledge gaps remain to be filled; what are future research directions? And (d) What challenges exist, and how can they be overcome? The follow-up break-out reports guided the closing discussions on the final day of the workshop.

In addition, several Implementation Interest Groups broke-out to review the status of ongoing projects, and to brainstorm about future efforts specific to Cascadia. Topics included Cascadia Initiative & Amphibious Arrays, Volcano Imaging, Geohazards, Energy & Mineral Potential, and Education & Outreach. Similar questions were posed to these break-out groups, including: (a) What infrastructure exists for Cascadia; what are associated opportunities? (b) What major research products and data streams will be available? (c) What gaps remain to be filled; what are the future directions for research? (d) What challenges exist, and how can they be overcome? Additional presentations addressed the important and diverse topic of Cascadia Geohazards, including those related to earthquakes, tsunamis and volcanoes. They also addressed the major new direction of earthquake early warning.

Throughout the workshop, students participated in plenary and breakout sessions, enthusiastically contributing to discussions. During lunches and in the evening, when most workshop participants had long since left the convention center, the symposium participants were still found hard at work. The students and postdocs ultimately developed a consensus statement emphasizing their take on the key aspects of the Cascadia system and the important scientific breakthroughs yet to come.

Roadmap to the Future – Science Implementation at Cascadia

Throughout the meeting, several key issues emerged from the presentation and discussions. A selection of these is listed below, and collectively they constitute a roadmap for refining the Cascadia science implementation plan. In most cases these issues cut across traditional discipline boundaries, and our understanding of them is impacted by multiple datasets.

The nature of segmentation along the subduction zone. Diverse data sets (geophysics, seismicity, volcano age and distribution, geochemistry, geodesy and paleogeodesy, etc.) reveal that the subduction zone is segmented along strike. Key uncertainties remain. Is the segmentation the same for different data sets? What are the ultimate controls of segmentation evident in different data? What is the influence of the incoming plate on segmentation? What is the influence of the inherited crustal structure and composition of the upper plate?

Earthquakes and the turbidite record. Inferences have been drawn from turbidite records that earthquakes rupture only part of plate boundary (M>~8 events) have regularly occurred in southern Cascadia with the northern portion rupturing only in entire-boundary, M9 earthquakes. These suggestions warrant further study as they have important impacts on hazard estimates and our basic understanding of the earthquake cycle along the plate boundary.

The hot and dry slab paradox. Uncertainty remains in reconciling the geochemical and petrological estimates of volatile fluxes in Cascadia with thermal models that predict a hot and dry subduction system. At present, measurements of pre-eruptive water contents seem relatively normal (compared to other arcs) in Cascadia basalts, however thermal models predict early dehydration and devolatilization. This remains an enigma for Cascadia. The relationship between timing of dehydration, extent of dehydration and the role of volatile fluxes in magmatism remains unclear.

Distribution of volcanism. What are the ultimate controls on the distribution of volcanism in Cascadia? Specifically, what parameters influence the formation of large central volcanoes that occur along the arc versus the more dispersed monogenetic volcanism that characterizes the regions between the larger volcanoes? Can this distribution be linked to the slab, structures in the mantle wedge, or in the upper plate? How do the relatively localized back-arc volcanic complexes (Simcoe, Newberry, Medicine Lake) relate to the arc system? What are the roles of mantle fluxes, solid/fluid flow vectors, and crustal magma processing?

Role of surrounding regions. Cascadia did not develop in isolation, and important questions remain regarding the evolution of Cascadia in relation to surrounding geologic provinces? These include the Yakima fold and thrust belt, the Basin and Range, The High Lava Plains, Klamath/Sierra block, the Yellowstone hot spot trail and the Juan de Fuca ridge. How have the interactions between these geologic provinces changes through time to influence the formation and evolution of the North American continent?

Imaging the physical properties deep within the crust and upper mantle. Different models of subduction processes, including the transition from stick-slip to stable sliding along the megathrust and the migration of magma through the crust, are difficult to image geophysically. How can traditional techniques for imaging subsurface seismic velocity and electrical conductivity be improved to better image these processes? How can better images be integrated with other geophysical and geochemical observations?

Sediment transport. The transport of sediment from the subaerial forearc to offshore is a response to tectonic processes. Also, the sediment records of such transport provide insight to the past tectonic events. Specific questions relate to the role of subduction zone earthquakes in initiating landslides, in mobilizing sediment sources and in modulating estuaries as sediment storage compartment or conduits for offshore sediment delivery. Can records from lakes, especially landslide-dammed lakes, be archives of erosion history in the Coast Ranges? How effective are carbon and other biomarkers in tracing sediment through watersheds to the offshore and can these methods, along the sediment transport data, be applied to determine sediment mass balances for Coast Range watersheds located at different latitudes along the Cascadia margin?

These topics, arising from discussions at the Cascadia workshop, informed the implementation plan developed for the Cascadia margin, specifically to guide proposals submitted to the GeoPRISMS Program, but of broad interest to the research community. The full workshop report for the Cascadia Science Workshop and the final GeoPRISMS Implementation Plan can be accessed and downloaded from the meeting website: http://www.geoprisms.nineplanetsllc.com/past-meetings/207-cascadia-apr2012.html

 Reference information
GeoPRISMS – EarthScope Science Workshop for Cascadia Report, Abers, G., Arrowsmith, R., Gomberg, J., Goodliffe, A., Kent, A., Kelley, K., Kelsey, H., Morgan, J., Roering, J., Trehu, A. and Wang, K.;
GeoPRISMS Newsletter, Issue No. 29, Fall 2012. Retrieved from http://geoprisms.nineplanetsllc.com

COAST: Cascadia Open-Access Seismic Transects


Steve Holbrook1, Graham Kent2, Katie Keranen3, Paul Johnson4, Anne Trehu5, Harold Tobin6, Jackie Caplan-Auerbach7, Jeff Beeson5

1University of Wyoming; 2University of Nevada; 3University of Oklahoma; 4University of Washington; 5Oregon State University; 6University of Wisconsin; 7Western Washington University

The Cascadia margin, where the Juan de Fuca and Gorda plates subduct beneath North America, poses substantial (but poorly understood) earthquake and tsunami hazards to the Pacific Northwest. Several major scientific infrastructure and research initiatives are focusing effort on the Cascadia margin. These include GeoPRISMS, EarthScope, encompassing the Plate Boundary Observatory (PBO), the Cascadia Initiative of ocean-bottom seismometers (OBS) with extensive onshore seismometers and geodetic stations associated with the Amphibious Array Facility, the Ocean Observatories Initiative (OOI) and NEPTUNE/CANADA cable observatories, and the SeaJade OBS program off Vancouver Island. GeoPRISMS has selected Cascadia as a focus site, and the first deployment of the Cascadia Initiative OBSs included a concentration of instruments off Grays Harbor, Washington (see GeoPRISMS Newsletter Issue 27, 2011). Here we report on a recently completed, open-participation/open-access geophysical survey of the Cascadia margin off central Washington, which provides new opportunities to participate in Cascadia studies.

Figure 1. (A) Map of COAST track lines (labeled 1-11), plotted on multibeam bathymetric grid acquired during MGL1212. (B) Inset map showing location of COAST survey on Cascadia continental margin. Bathymetry contoured at 500 m intervals. (C) Example of post-stack time migration across deformation front on Line 4 (yellow line, Fig. 1A).

Figure 1. (A) Map of COAST track lines (labeled 1-11), plotted on multibeam bathymetric grid acquired during MGL1212. (B) Inset map showing location of COAST survey on Cascadia continental margin. Bathymetry contoured at 500 m intervals. (C) Example of post-stack time migration across deformation front on Line 4 (yellow line, Fig. 1A).

The COAST (Cascadia Open-Access Seismic Transects) survey comprised a successful, two-week cruise of the R/V Langseth in July 2012 that acquired diverse geophysical data, including multichannel seismic reflection, multibeam bathymetry, gravity, and magnetic data in a high-priority corridor of the Cascadia margin off Grays Harbor. The scientific goals of this project include (1) constraining the position of the plate boundary, which is poorly known in this region; (2) imaging downdip variations in the character of the subduction thrust across the transition from aseismic creep to seismogenic rupture; (3) quantifying pore fluid pressure, fluid budgets, and upstream inputs to the zone of episodic tremor and slip; and (4) determining the geological controls on methane distribution in the forearc. Substantial shipboard processing efforts produced seismic sections processed through post-stack migration, as well as bathymetric data that provide nearly complete coverage of the forearc region (Fig. 1). Shipboard processing of the data provides the following initial observations:

(1) The Pleistocene accretionary wedge is well imaged and shows landward-vergent thrust faulting throughout our survey area. An outboard series of ramp-and-thrust structures gives way to a region characterized by folds that separate “oases” of undeformed sediment. (2) The oceanic basement reflection is strong and clear outboard of the deformation front but becomes much weaker beneath the Pleistocene wedge. At this stage of processing it is not clear whether this reflects inaccurate processing, loss of energy by scattering off a complex surface, or (more intriguingly) a physical change in the plate boundary structure. (3) Where it is imaged beneath the margin, the top of oceanic crust appears gently dipping beneath the Pleistocene wedge, then bends into a steeper inclination beneath the Miocene wedge. (4) A widespread methane hydrate system, indicated by bottom-simulating reflections, exists in the outer wedge and upper slope of the study area. Increased amplitudes of the Bottom Simulating Reflection (BSR) in tilted sediments suggest that fluid flow along bedding planes controls methane flux.

The COAST program was the first Langseth cruise conducted as an open-participation/open-access cruise. Participants were selected by an open application process, through which seventeen members of the science party were selected from over 60 applicants. Of the twenty members of the visiting science party, eight had not previously been aboard a research vessel, and an additional five (13 total) had never participated in a marine seismic reflection survey. A robust daily shipboard education program included science lectures, scheduled tutoring on seismic processing, and informal data interpretation.

All cruise data are open-access and available immediately. Raw geophysical and seismic data can be downloaded from the LDEO website. Seismic sections processed shipboard through post-stack time migration can be downloaded from the UTIG seismic data base. The cruise report can be downloaded here. We encourage all interested parties to make use of the COAST data in any way desired, including writing proposals to process and analyze the data, integrating the data with other recent and ongoing Cascadia initiatives, and incorporating the data and images in the classroom.

 Reference information
COAST:  Cascadia Open-Access Seismic Transects, Holbrook, S., Kent, G., Keranen, K., Johnson, P., Trehu, A., Tobin, H., Caplan-Auerbach, J., Beeson, J.
GeoPRISMS Newsletter, Issue No. 29, Fall 2012. Retrieved from http://geoprisms.nineplanetsllc.com

Student Seagoing Experiences: The 2013 Cascadia Initiative Expedition Team’s Apply to Sail Program


Compiled by Emilie Hooft (University of Oregon) for the Cascadia Initiative Expedition Team 

During the summer of 2013 the Cascadia Initiative Expedition Team led six oceanographic expeditions to recover and redeploy ocean bottom seismometers (OBSs) across the Cascadia subduction zone and Juan de Fuca plate. The Cascadia Initiative (CI) is an onshore/offshore seismic and geodetic experiment to study questions ranging from megathrust earthquakes to volcanic arc structure to the formation, deformation and hydration of the Juan de Fuca and Gorda plates with the overarching goal of understanding the entire subduction zone system. These objectives are all components of understanding the overall subduction zone system and require an array that provides high quality data, crosses the shoreline and encompasses relevant plate boundaries. The CI is the first to utilize a new generation of OBSs that are designed to withstand trawling by fisheries, thus allowing the collection of seismic data in the shallow water that overlies much of the Cascadia megathrust.

Figure 1. Cascadia Initiative experiment design: PBO GPS stations upgraded as part of the Cascadia Initiative (black triangles) and broadband seismometers (circles) expected to operate in the Cascadia Region between 2011 and 2015. The 2010 workshop report1 contains a detailed discussion of the color-coded seismometer experiments and the schedule of deployments.

Figure 1. Cascadia Initiative experiment design: PBO GPS stations upgraded as part of the Cascadia Initiative (black triangles) and broadband seismometers (circles) expected to operate in the Cascadia Region between 2011 and 2015. The 2010 workshop report1 contains a detailed discussion of the color-coded seismometer experiments and the schedule of deployments.


figure2_CIET_report_field_fall2013

Figure 2. Robert Anthony (New Mexico Institute of Mining & Technology) counts how many SIO Abalone remain to be deployed.

We all gathered on the deck as the persistent thumping of the Oceanus’s V16 diesel died away and the slow lapping of waves against the stern took its place. Our GPS indicating that we were in the correct spot, the crew began operating the crane to raise the oven-sized Ocean Bottom Seismometer (OBS) over the starboard side. For a second, the florescent yellow casing on the instrument was picked up by the ship’s floodlights, illuminating the instrument package against the dark, endless expanse of the Pacific Ocean. Then, just as quickly, it was released from its tether and engulfed by the swell. I leaned overboard and watched as the blinking light affixed to the top of the instrument silently faded away, eclipsed by the murky depths of the sea. Turning my back on this makeshift funeral, I imagined the OBS settling on the alien terrain of the ocean floor, perhaps on a turbidite flow. As the ship’s diesel fired back to life and set course for the next drop off location, I thought about the OBS one day disengaging from its anchor and rising back up through the water column, possibly carrying with it the key to predicting crucial properties of the next submarine landslide-triggering earthquake.Robert Anthony, Graduate Student at New Mexico Institute of Mining and Technology

The CI is a plate-scale experiment that provides a unique opportunity to study the structure and dynamics of an entire oceanic plate, from its birth at a spreading center to its subduction beneath a continental plate. Together with the land stations that are part of the amphibious array and other land networks, the OBSs will provide coverage at a density comparable to the Transportable Array of Earthscope from the volcanic arc out to the Pacific-Juan de Fuca spreading center segments.

I was a member of the first leg of the 2013 CIET cruises. I was extremely nervous about every aspect of the cruise, including the bunk rooms and food. The first few days were great. I learned about ocean bottom seismometer retrievals and a bit about each of the crew members. Then we started experiencing high winds and seas. I had stopped taking my seasickness medicine, so I spent most of the time in my bunk. During the last four days of the cruise, I helped with retrieving and securing the seismometers. I spent a lot of time talking with the crew from Woods Hole Oceanographic Institute. I also learned that the entire crew has a special skill to do what they do, especially with significant weather. Even though a few days were terrible for me, I will gladly join a scientific cruise again, as long as I don’t forget my seasickness pills.Hannah Mejia, Graduate Student at California State Polytechnic University, Pomona
Figure 3. The WHOI team recovering an OBS.

Figure 3. The WHOI team recovering an OBS.

The CI is a community experiment that provides open access to all data via the IRIS Data Management Center, thus ensuring that the scientific return from the investment of resources is maximized. The Cascadia Initiative Expedition Team (CIET) is a group of scientists who are leading the seagoing expeditions to deploy and recover OBSs and the team just completed its third year of data acquisition. The CIET maintains a website for the community where information regarding CI expeditions and OBS metadata are provided.

Having sat through several planning meetings and teleconferences in which the community hashed out where exactly the ARRA Cascadia Initiative OBS units would be deployed, it was a real pleasure to actually participate in the CI Leg 5 deployment cruise. Prior to the cruise, OBSs were a bit of a mystery, and it was fascinating to see their various parts and pieces and well-engineered simplicity. Some of the pieces were familiar, such as the Trillium Compact seismometer, although its casing that houses a 360-degree gimbal was new; others were completely foreign, most notably “syntatic foam” which doesn’t significantly compress even at 6000 m, or 200 bar pressure. It never occurred to me that one can’t use any old flotation foam, nor that fishing trawler resistance is a key design criteria of OBSs in general, and particularly offshore the Cascadia margin.Tim Melbourne, Professor at Central Washington University

The CI also includes a significant education and outreach component that is providing berths for students, post-docs and other scientists to participate in either deployment or recovery legs, thus providing the seismological community with opportunities to gain valuable experience in planning and carrying out an OBS experiment. In total, 51 applicants from the US and 4 other countries applied to sail on the 2013 cruises; 21 graduate students as well as a few undergraduate students, postdocs and young scientists from the US and Canada were chosen to join the crew.

Figure 4. Tim Melbourne (Central Washington University) explains the GPS component of the Cascadia Initiative during an onboard science meeting.

Figure 4. Tim Melbourne (Central Washington University) explains the GPS component of the Cascadia Initiative during an onboard science meeting.

My time on the R/V Atlantis showed me first hand that the geology of the sea floor is just as interesting and diverse as the geology on land. One of the most memorable things to me was our use of the bathymetry equipment to scan Hydrate Ridge, which is a formation composed of methane hydrate – a flammable substance that looks like ice. It is amazing to think that every time we sent the JASON ROV down to collect a seismometer, its cameras were looking at a part of the sea floor that had never been looked at before. This really drove home the idea that some things that we take for granted when working on land, such as orientation of the seismometer during installation and the ability to look carefully at the rock and sediment that it is installed on, are much more difficult to achieve when working at sea – it really does present a completely different set of challenges.Anton Ypma, Graduate student at Western Washington University

Sailing on the R/V Atlantis was an amazing opportunity to learn more about ocean seismology and ocean-bottom seismometers (OBS). I had little experience with in situ seismic observations and instrumentation prior to the cruise. I learned a tremendous amount about how the OBS detects movements in the Earth’s crust, the advantages of the different encasing designs (e.g. trawl resistant mounts (TRM), pop-ups & float – ups), and the recovery process for each design structure. I appreciate the folks from Lamont-Doherty Earth Observatory who answered my many questions regarding OBS’s and allowed me to get a hands-on experience helping them break down the TRM’s after recovery.Katie Kirk, Graduate Student at Cornell University and Woods Hole Oceanographic Institution

Having never done field work in seismology, what stood out most from this cruise was the incredible design and engineering that went into collecting this data. Seeing a team of scientists and engineers coordinating with the crew of a ship, I felt struck by the reality of what science in action looks like, and what can be accomplished through collaboration. I didn’t know what to expect from ship life, but to sum it up concisely: The motion of the ocean stops for no stomach. The motion of the ocean is also soothing, and often sleep-inducing after lunch, so plan accordingly. The ship is well-stocked with books, movies, games, and characters to enjoy them with. The food is very, very good. And there is nothing quite like the crashing of waves against the hull as you watch moonlit clouds float by over a landless skyline.Laura Fattaruso, University of Massachusetts Amherst

The cruises lasted from 6 to 14 days in length. OBS retrievals comprised the three first legs, of which the first two were aboard the Research Vessel Oceanus. The third retrieval leg was aboard the Research Vessel Atlantis and utilized the submersible Remotely Operated Vehicle (ROV) Jason. The ROV was used to recover 12 of the 30 seismometers for this last retrieval mission. The final three legs were OBS deployments conducted with the assistance of the Research Vessel Oceanus.

Figure 6. AB Doug Beck helps Brooklyn Gose (Undergraduate at University of Oregon) with an albacore tuna

Figure 6. AB Doug Beck helps Brooklyn Gose (Undergraduate at University of Oregon) with an albacore tuna

Figure 5. Samantha Bruce (Adjunct Instructor at College of Charleston) holding a starfish in front of ROV Jason.

Figure 5. Samantha Bruce (Adjunct Instructor at College of Charleston) holding a starfish in front of ROV Jason.

I woke up and immediately realized that the boat was unusually still. Even though it was nearly 11 o’clock in the morning, I felt groggy. I had volunteered for the night shift and we had only been at sea for a few days so my body wasn’t fully adjusted to the new schedule. I got dressed and made my way to the top of the steps leading to the science lab. The WHOI team had their hardhats and life vests on and were darting into the lab and back out onto the deck-clearly hard at work. We were stopped because during the last deployment one of the ARRA OBSs had failed to respond when pinged almost as soon as it was released into the water. A similar situation had happened to us the day before with the ARRA ceasing to respond about halfway through its descent. With the recent failure, there was now a major dilemma. Of the three ARRAs deployed, two were not responding. The WHOI team was busy testing the remaining OBSs by submerging them, pinging and waiting to hear a response. The chief scientists spent the day pouring over maps, sending emails and developing plans for the worst case scenario. As the day progressed, we were still no closer to understanding the problem. It was decided that the ARRA component designed to send and receive signals needed to be tested at depth. The WHOI team gutted the cage holding all the CTD equipment and attached the ARRA parts. Each ARRA was tested and each ARRA continued to function normally. By now we had an updated itinerary that paired priority sites with the KECK OBSs that seemed more stable. The cruise continued with the stipulation that if one more ARRA failed then they would no longer be deployed. It made the next few sites extremely intense, but as the days went by without incident the anxiety began to lift. In the end, the two ARRAs that failed at the beginning of our voyage were the only two to do so and we still finished ahead of schedule.Miles Bodmer, Graduate Student at University of Oregon

It took landing in the middle of the craton in Indiana at the beginning of undergrad to make me realize that I have always wanted to live and work near the ocean. My time on the R/V Oceanus was the first opportunity to spend multiple days at sea, working on a small subset of a large scientific initiative. It seemed that every time I rolled out of bed, bleary-eyed and unaware whether it was night or day, something new was happening on deck. Fishing for tuna on hand-lines tied to the back of the boat, watching a pod of orca whales gambol around our boat or playing with a makeshift cornhole set, there was always something new to see. The engineers were great, and I overheard them explaining each remarkable mechanism making up their OBS design with enthusiasm and pride. After a couple of days I was nipping into the galley for a midnight snack or popping up to the bridge with the feeling of being one of the crew, part of the ship, necessary. Though this ship will drop us off and its crew will depart again within the week leaving us to return to our mainland institutions, I am sure this will not be my last voyage.Kasey Aderhold, Graduate Student at Boston University
Figure 7. Two young orcas playing.

Figure 7. Two young orcas playing.

More descriptions and pictures of individual at-sea experiences are on the CIET Website. The 21 Apply-to-Sail participants for 2013 listed in the order of cruise participation are: Hannah Mejia, California State Polytechnic University Pomona; Sara Kowalke, University of Minnesota; Stanislav Edel, New Mexico Institute of Mining and Technology; Laura Fattaruso, University of Massachusetts Amherst; Lexine Black, California State University, Northridge; Anton Ypma, Western Washington University; Samantha Bruce, College of Charleston; Katie Kirk, Cornell University & Woods Hole Oceanographic Institution; Christina King, University of Rhode Island; Ye Tian, University of Colorado at Boulder; Miles Bodmer, University of New Mexico; Robert Skoumal, Miami University; Kasey Aderhold, Boston University; Robert Anthony, New Mexico Institute of Mining and Technology; Shannon Phillips, University of Oregon; Tim Melbourne, Central Washington University; Brooklyn Gose, University of Oregon; Xiaowei Chen, Woods Hole Oceanographic Institution; Yajing Liu, McGill University; Harmony Colella, Miami University of Ohio; Martin Pratt, Washington University in St. Louis. ■

“Report from the Field” was designed to inform the community of real-time, exciting GeoPRISMS -related research. Through this report, the authors expose the excitement, trials, and opportunities to conduct fieldwork, as well as the challenges they may have experienced by deploying research activities in unique geological settings. If you would like to contribute to this series and share your experience on the field, please contact the GeoPRISMS Office at info@geoprisms.nineplanetsllc.com. This opportunity is open to anyone engaged in GeoPRISMS research, from senior researchers to undergraduate students.
We hope to hear from you!

 Reference information
Student Seagoing Experiences: The 2013 Cascadia Initiative Expedition Team’s Apply to Sail Program , Hooft E. for the Cascadia Initiative Expedition Team
GeoPRISMS Newsletter, Issue No. 31, Fall 2013. Retrieved from http://geoprisms.nineplanetsllc.com

A Geophysical and Hydrogeochemical Survey of the Cascadia Subduction Zone


H. Paul Johnson1, Evan A. Solomon1, Robert Harris2, Marie Salmi1, Richard Berg1
1 School of Oceanography, University of Washington, Seattle, 2 COAS, Oregon State University, Corvallis
The R/V Atlantis

The R/V Atlantis

Our 204 heat flow and 23 fluid flux stations survey along a single cross-margin profile is the highest resolution series of such measurements ever made on a subduction zone accretionary wedge. Combined with previous R/V LANGSETH multi-channel seismic data previously acquired along the same profile, these measurements reveal a wealth of detail of active fluid pathways, tectonic complexity, and diverse thermal environments for the previously unstudied accretionary prism off the Washington coast. Processing of these rich data sets is just beginning but preliminary analysis of the results reveals several unexpected findings. These include the inflow of seawater into at least the uppermost sediment layers above the deformation front and first anticlinal ridge, higher temperatures (~225°C) of the sediment-basement interface at the deformation front than previously recognized and methane-rich fluid flux with a geochemical signature indicating that these fluids originate from a deep source at temperatures greater than 80°C within the accretionary prism. The Cascadia Subduction Zone (CSZ) that dives beneath the North American continent is relatively quiescent but poses a great seismic hazard to the NE Pacific coast. Although the northern and southern portions of the CSZ off-shore the Vancouver Island and Oregon coasts have been studied over the past 50 years, detailed geophysical studies of the section off the Washington State margin have been limited until recently due to its proximity to sensitive U.S. Navy access routes. With the lifting of the ban on high resolution multi-beam bathymetry maps of the area and the recognition that the CSZ is a quiet but active fault zone, the 250 km length of the Washington portion has received new attention, which included its election as a focus site for the National Science Foundation GeoPRISMS Program, a target area for the Cascadia Initiative Expedition Team Ocean Bottom Seismic array, and the focus of two multi-channel seismic surveys using the R/V LANGSETH in 2012. In August, 2013, we conducted a 30-day detailed heat flow and fluid flux survey along a single across-strike profile of the Washington margin from the abyssal plain west of the deformation front of the accretionary wedge at 3000 meters depth to the continental shelf at 160 meters water depth using the R/V ATLANTIS and the ROV JASON II. The scientific goals of this cruise were to:

  1. Determine the temperatures along the décollement of the CSZ megathrust fault, since temperature is an important influence on the locked portion of the fault.
  2. Identify and quantify both shallow and deep-seated fluid flow within the accretionary sediment wedge that overlies the megathrust fault zone.
  3. Test the hypothesis that active hydrothermal circulation within the subducting oceanic crust is occurring and if so, whether this oceanic plate aquifer is mining heat from deep within the subduction zone and serving as a ‘cold-finger’ for thermal processes beneath North American margin.
Figure 1. Top Image shows heat flow instrument sites from August 2013 GeoPRISMS cruise, including Jason short-probe, thermal blanket deployments, and OSU long-probe sites. Light grey lines are LANGSETH MCS 2012 survey lines. Insert shows general location of survey area. Lower map shows fluid flow sampling sites, including Mosquito flow meters, Jason push cores and multi-corer sediment coring sites.

Figure 1. Top Image shows heat flow instrument sites from August 2013 GeoPRISMS cruise, including Jason short-probe, thermal blanket deployments, and OSU long-probe sites. Light grey lines are LANGSETH MCS 2012 survey lines. Insert shows general location of survey area. Lower map shows fluid flow sampling sites, including Mosquito flow meters, Jason push cores and multi-corer sediment coring sites.

Figure 2. Top panel shows JASON short-probe heat flow data over the Deformation Front and First Anticlinal Ridge shown in Figure 1. Red bars show locations of reduced heat flow areas hypothesized to be areas of fluid inflow into the upper sediment layers. Lower LANGSETH seismic profile is co-registered with the heat flow stations and shows the Juan de Fuca plate entering the CSZ from the right and the deformation front and First Anticlinal Ridge. The x-axis is MCS Common Depth Point where 400 CDPs represents 2700 meters.

Figure 2. Top panel shows JASON short-probe heat flow data over the Deformation Front and First Anticlinal Ridge shown in Figure 1. Red bars show locations of reduced heat flow areas hypothesized to be areas of fluid inflow into the upper sediment layers. Lower LANGSETH seismic profile is co-registered with the heat flow stations and shows the Juan de Fuca plate entering the CSZ from the right and the deformation front and First Anticlinal Ridge. The x-axis is MCS Common Depth Point where 400 CDPs represents 2700 meters.

Although designed as a stand-alone research experiment, our field program is integrated with other recent and continuing GeoPRISMS and Department of Energy Hydrate Programs on Cascadia Subduction Zone. This integration is both a benefit and a necessity given the complex interdisciplinary scientific processes that are presented on the Washington margin. For example, we took advantage of the LANGSETH 2012 Multi-Channel Seismic (MCS) lines to identify sub-surface structures in our survey area and conducted heat flow and fluid flux measurement profiles over Line 4 from that cruise. Our data will also be eventually linked to the Cascadia Initiative Expedition Team (2011-2014) Ocean Bottom Seismometer data to help understand CSZ seismic behavior and hazards and to the planned Department of Energy cruise on the R/V THOMPSON (Solomon and Johnson) that focuses on understanding the response of upper slope gas hydrates to the observed warming of intermediate depth water temperatures off the Washington margin. In order to construct a single high-resolution profile of heat flow and fluid flux measurement across the Washington accretionary prism and adjacent abyssal plane we employed the entire suite of geophysical and hydrological tools available in order to approach the above scientific problems with a comprehensive program. Using the ROV JASON II, we deployed short heat flow probes (204 measurements), 28 thermal blankets, 23 Mosquito flow meters, and took 20 push cores to sample near-surface sediments for pore water chemistry. From the ATLANTIS surface ship we conducted EM122 detailed bathymetry and acoustic backscatter images from the abyssal plain to the shallow continental shelf, 9 CTD casts, 15 multi-core sediment recoveries, and 36 Oregon State University long-probe heat flow insertions.

Figure 3. (left) JASON photo of Mosquito flow meter (left) and thermal blanket (right). (middle) Deployment of dual JASON short probe heat flow instruments, used for redundant measurements at a single heat flow site. (right) Frame grab of JASON video image of actively-forming authigenic carbonate deposit at a methane bubble emission site at 1000 meters water depth. Vertical dimension of photo is about 3 meters.

Figure 3. (left) JASON photo of Mosquito flow meter (left) and thermal blanket (right). (middle) Deployment of dual JASON short probe heat flow instruments, used for redundant measurements at a single heat flow site. (right) Frame grab of JASON video image of actively-forming authigenic carbonate deposit at a methane bubble emission site at 1000 meters water depth. Vertical dimension of photo is about 3 meters.

Remotely Operated Vehicle Jason II deployment operations during the R/V Atlantis cruise off the Washington Coast. Photo Credit Una Miller, UW/Oceanography student.

Remotely Operated Vehicle Jason II deployment operations during the R/V Atlantis cruise off the Washington Coast. Photo Credit Una Miller, UW/Oceanography student.

While these data sets are still being analyzed some results reveal the potential for preliminary interpretation. At the Juan de Fuca oceanic plate approach to the Washington CSZ heat flow data from all three applied methods (JASON short-probe, thermal blankets, OSU long-probe) yield a consistently high heat flow average value of near 100 mW/m2. When this value is downward continued through the incoming sediment column using in situ near-surface thermal conductivities combined with deeper values derived from LANGSETH seismic velocities it yields a basement-sediment interface temperature just west of the deformation front of 225°C. This newly estimated temperature substantially exceeds the canonical values of 100-150°C for fluid production from the smectite-illite transition previously used to define the up-slope boundary of the locked portion of megathrust faults. As our survey moves eastward across the deformation front and up-slope over the ‘second anticlinal ridge’, the closely-spaced heat flow measurements illuminate high spatial variability. This is caused by fluid flow that previously could not be resolved with widely-spaced surface ship measurements. These data show two narrow zones of dramatically decreased heat flow values over the summits of the two westernmost structures that can be interpreted as the inflow of seawater into the dilated uppermost sediment layers. Seismic profiles from the LANGSETH 2012 MCS survey also show structures resembling keystone graben faults at the summits of these western anticlinal ridges, which is consistent with a dilating upper sediment section. Ongoing processing of data from our Mosquito flow meters, sediment cores, and additional heat flow stations will further test this hypothesis. The Washington margin has been recognized for over 50 years as a methane-rich accretionary prism and recent studies have strongly reinforced this view. Our initial EM122 profiles of the survey area at the beginning of the cruise prior to launching our first JASON dives located several active methane emission sites with active bubble plumes rising hundreds of meters into the water column. During the course of the deployment of heat flow and fluid flux stations along the profile we encountered extensive areas of calcium carbonate pavements at the seafloor which in some areas resisted penetration of our heat flow probes and sediment coring instruments. At a thousand meters water depth we discovered several areas of active methane gas emissions and actively forming authigenic carbonate deposits, with delicate aragonite precipitation structures currently forming on the edges of massive carbonate slabs that were several meters thick and hundreds of meters in horizontal dimension. The basic heat flow and fluid flux work are the central data sets for two University of Washington PhD theses (M. Salmi and R. Berg). Processing of the abundance of diverse data collected over our 30-day field program is in progress and will be a fertile data set upon which to base future studies of the Cascadia Subduction Zone. An extension of the original NSF proposed work is a high resolution video survey as an experiment-of-opportunity of three of these methane emission sites and carbonate formation zones with the JASON video camera during the 2013 cruise. These video data and returned carbonate samples are now the core of a previously unplanned UW undergraduate (U. Miller) research project. ■

CSZ_newsletter_bubblesFunding was through the NSF GeoPRISMS Program with grateful acknowledgement to the crews of R/V ATLANTIS and ROV JASON II. Scientific Party Team listed alphabetically consisted of Rick Berg, Tor Bjorklund, Rick Carlson, Dan Culling, Rob Harris, Casey Hearn, Kira Homola, Paul Johnson, Peter Kalk, Alex Mesher, Una Miller, Brendon Pratt, Adrian Rembold, Marie Salmi, Evan Solomon, and Jon Yang. The cruise investigators subscribe to the NSF Open Access policy and after initial processing the full suite of data will be available online.

Reference information
A Geophysical and Hydrogeochemical Survey of the Cascadia Subduction Zone, Johnson, H.P., Solomon, E.A., Harris, R., Salmi, M., Berg, R.
GeoPRISMS Newsletter, Issue No. 32, Spring 2014. Retrieved from http://geoprisms.nineplanetsllc.com