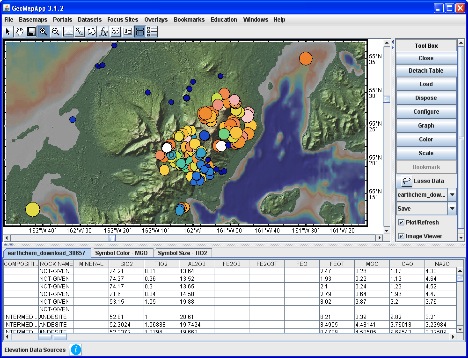
Figure 2. EarthChem geochemistry data from the Alaska Peninsula imported to GeoMapApp. Sample location symbols are colored on MgO and scaled on TiO2. Identification of data trends is enhanced with GeoMapApp’s graphing function (right, with K2O plotted against SiO2). Samples can be selected using a lasso tool and both the samples and map view can be exported.