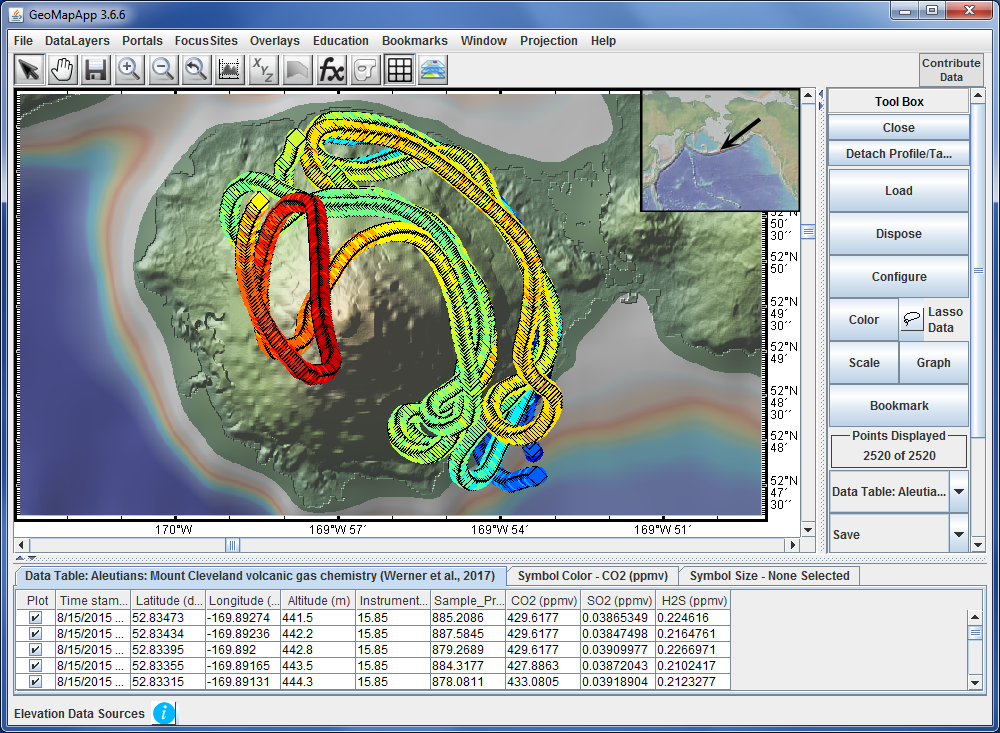
Figure 1. Werner et al. CO2 trace gas concentration at Mount Cleveland volcano from a survey in August 2015. The data set is available in GeoMapApp under both the Geochemistry and Focus Sites menus. In this image the symbols indicate the helicopter flight path and have been coloured blue (low CO2 concentration) to red (high).The background map is the Global Multi-Resolution Topography (GMRT) synthesis which incorporates the USGS NED land topography data for the Aleutian arc.