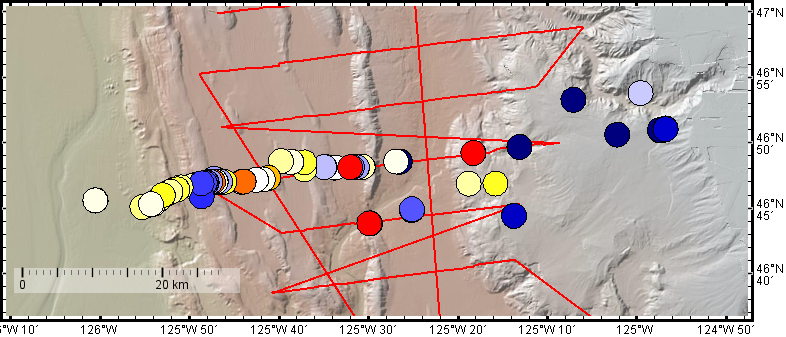
Figure 2. Shown as circles, Alvin probe seafloor heat flow data across part of the Cascadia margin is coloured according to heat flow value, from blue (low) through white, to red (high). The red track shows the location of BSR-derived heat flow values from MGL1212 multi-channel seismic profiles. The Global Multi- Resolution Topography (GMRT) synthesis forms the background bathymetry map. Image made with GeoMapApp. The data sets are accessible through the GeoMapApp menus.