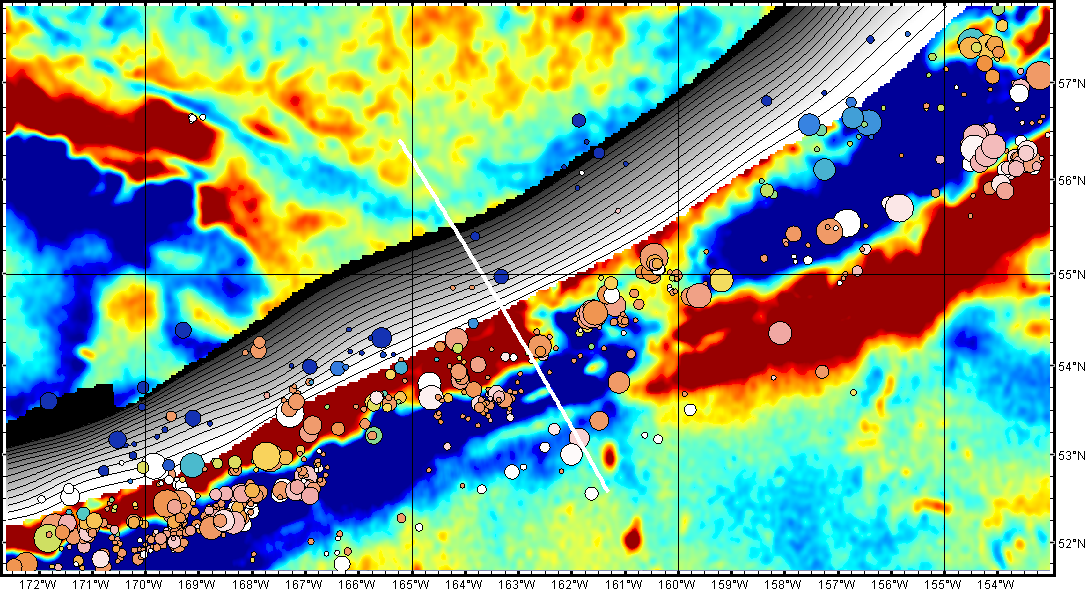
Figure 2a. For the Shumagin Gap area in the Aleutians primary site, the residual gravity free-air anomaly of Bassett and Watts (2015) is shown. Dark blue represents anomalies < -50 mgals and dark red depicts anomalies > 50 mgals. The contoured grey-shaded structure trending across the image is the depth to the top of the subducting slab from Syracuse and Abers (2006). Circles are the epicentral locations for earthquakes greater than magnitude 5.0 from the USGS-ANSS catalogue. The symbols are colored on depth, with warmer colors showing deeper foci, and scaled by magnitude. The white line in the center of the image shows the location of the stacked profiles presented in Fig 2b. Image made with GeoMapApp. All of the data sets shown are accessible through the GeoMapApp menus. An enhanced GeoMapApp Save Session function allows the layering and visualisation parameters of all of the displayed data sets to be stored for future use.