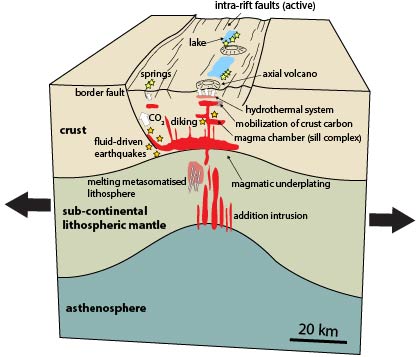
Figure 2. Production and transport of magmatic CO2 at continental rift settings modified from Hunt et al. (2017). White arrows represent zones of CO2 fluid flow, yellow stars are hydrothermal springs, and orange stars are deep earthquakes. The CO2 depicted exsolves from cooling upper and lower crustal magmas. The distribution of crustal magma (red polygons) is based on seismicity from Weinstein et al., (2017) and the seismic tomography model of Roecker et al. (2017).
Geodynamic Processes at Rifting and Subducting Margins

