HT-RESIST Hikurangi Trench Regional Electromagnetic Survey to Image the Subduction Thrust


Christine Chesley with Samer Naif and Kerry Key
LDEO, Columbia University

Because New Zealand’s north island lies at the juncture between the converging Pacific and Indo-Australian plates, it is not surprising that the area experiences earthquakes. A unique feature of the Hikurangi margin, the name of New Zealand’s subduction zone, is that its earthquake slip behavior varies from north to south along strike. The northern Hikurangi margin is characterized by shallow slow slip events (SSEs) and weak seismic coupling while the southern margin exhibits deeper SSEs and stronger coupling. The host of other properties that change along this subduction zone have motivated the question, “What controls the along-strike variation in megathrust behavior at the Hikurangi margin?”
One key element of this question lies in quantifying the porosity and fluid budget along the margin. Marine electromagnetic (EM) methods are well-suited for imaging fluids and fluid pathways within the lithosphere. Of course, a major caveat to any geophysical survey of convergent margins is the challenge of collecting good data on the seafloor beneath a deep ocean. So that is what we set out to do on 16 December 2018.
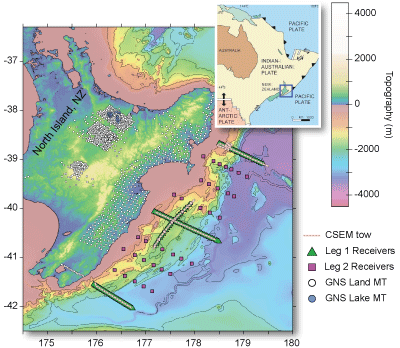
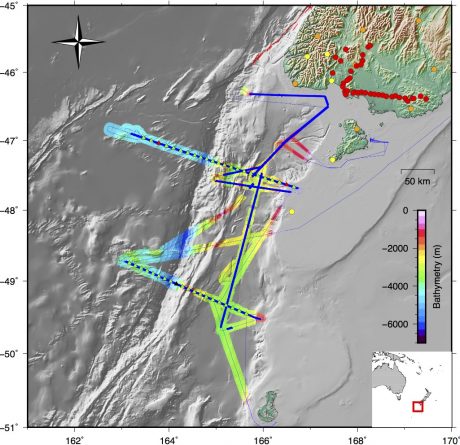
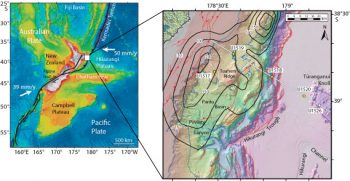
Figure 1. Survey map showing location of leg 1 OBEM deployments (green triangles), leg 2 OBEM deployments (magenta squares), CSEM tows (peach lines), and GNS land receivers (white and blue circles). Inset shows regional tectonics (from http://volcano.oregonstate.edu).

“We know about earthquakes here in Wellington,” asserted a waiter at the Thistle Inn. After a satisfying meal, my colleague and I were giving an abridged rundown of our cruise objectives to this excited employee. It was a day or so before we would leave for a month-long voyage to deploy ocean bottom electromagnetometers (OBEMs) for controlled-source electromagnetic (CSEM) and magnetotelluric (MT) imaging of the subseafloor off New Zealand’s north island. Curious about our business in New Zealand, our waiter warned us that talking about earthquakes was making people anxious in his country. Somehow, it was refreshing to find a non-geophysicist who thought our work was important. But it also impressed upon me the urgency to make this cruise a success.

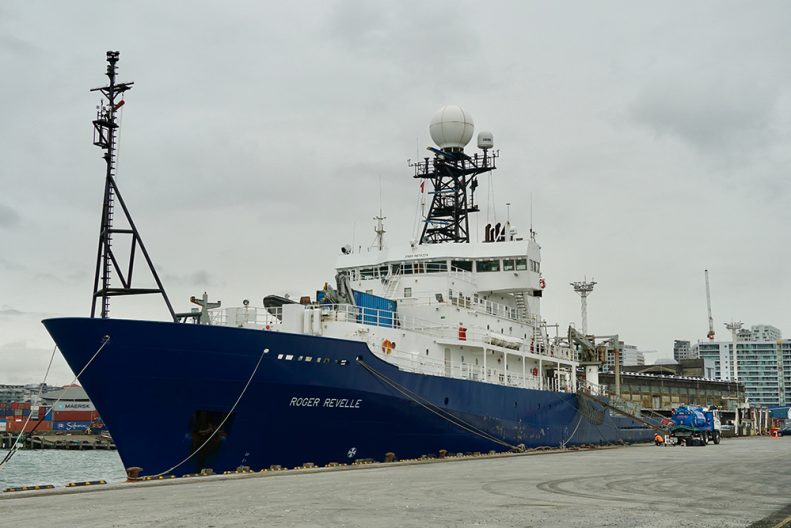
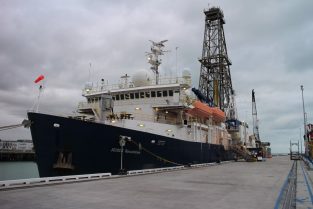
The cruise itself was divided into two legs, both of which were carried out on the R/V Roger Revelle. The first and longer of the two legs involved the collection of the four lines of CSEM data shown in Figure 1, in addition to the deployment of 42 OBEMs for collection of passive MT data. I had never been to sea for more than a few hours – as a geophysics PhD student, I would spend most of my days in front of a computer rather than performing manual labor. I am pretty accustomed to having stable ground beneath my feet and a bed that doesn’t rock at night.

Everything about the experience was new for me.
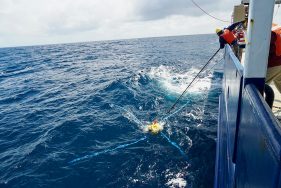
Before the cruise, I had only ever read about how our marine EM group collects data. Getting a firsthand look at the process has given me a tremendous amount of respect for how much effort goes into data collection, especially when things don’t go according to plan.

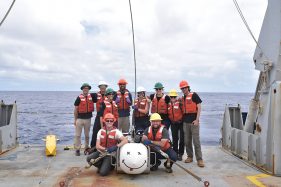
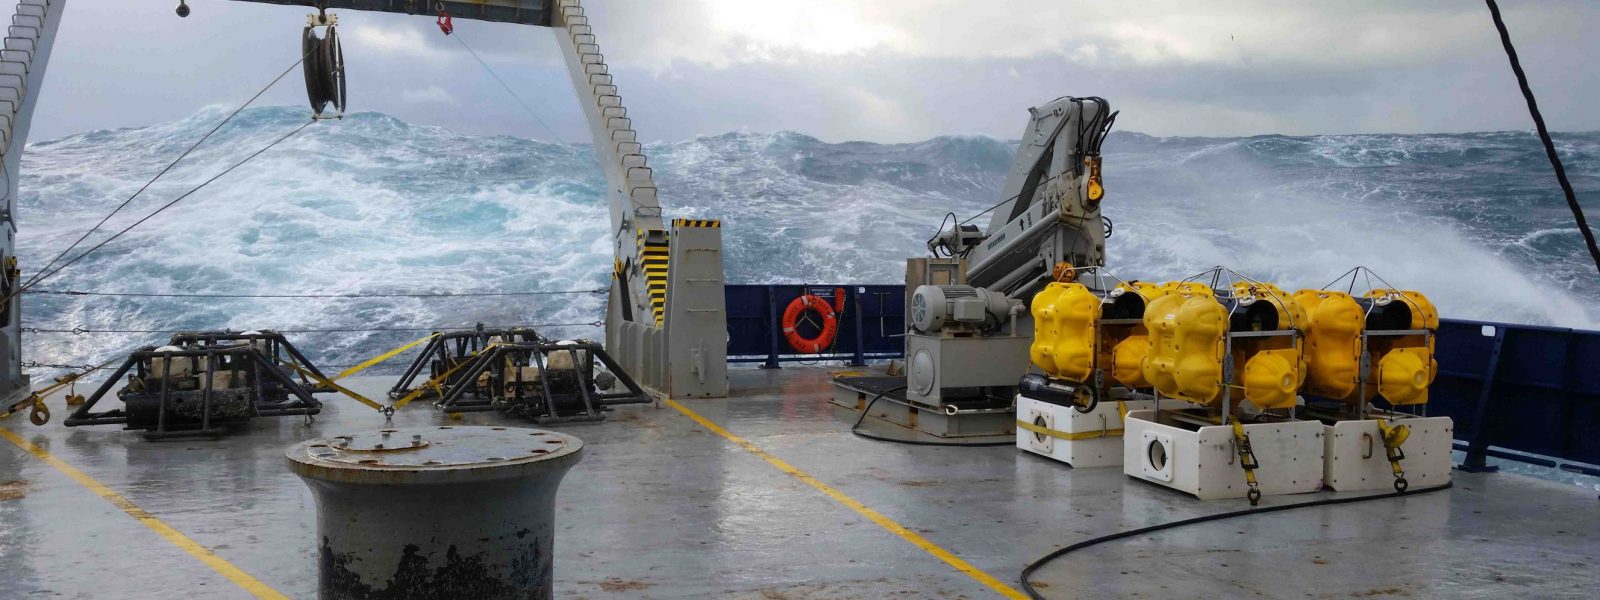
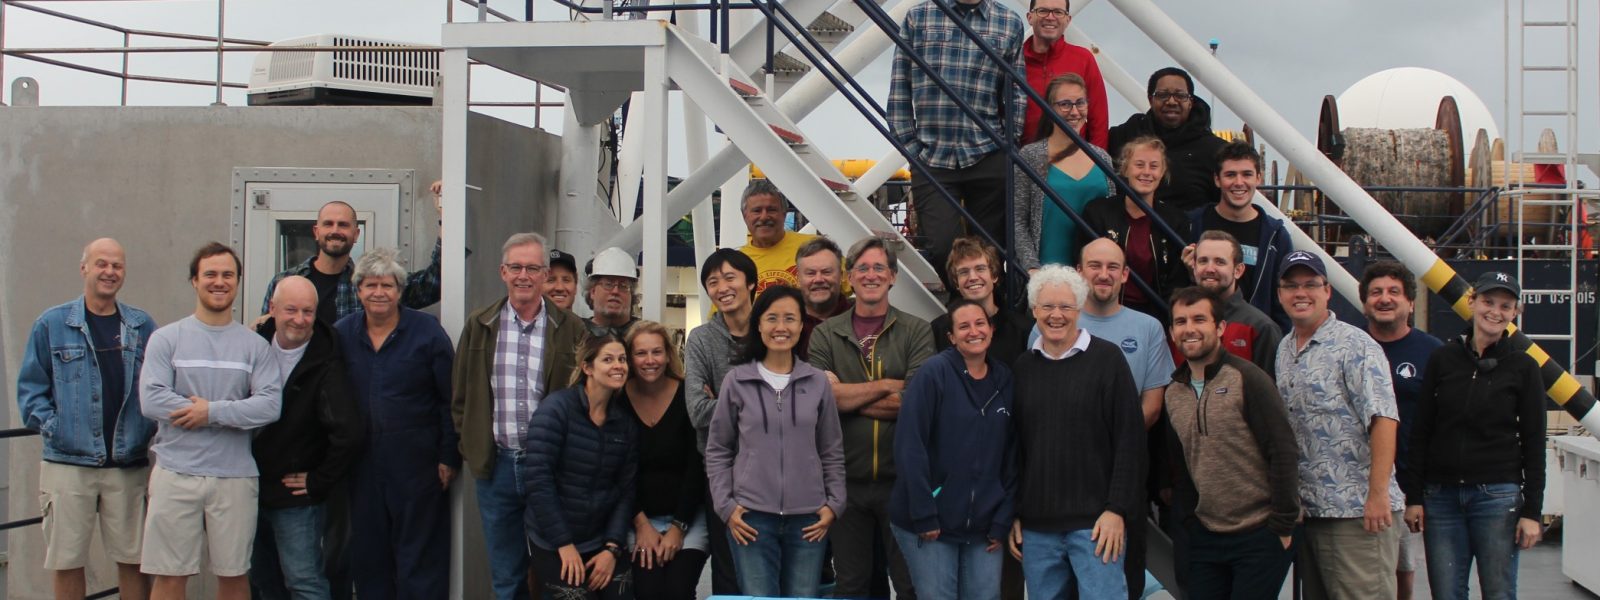
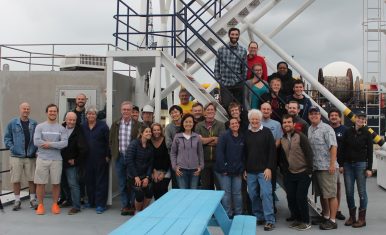
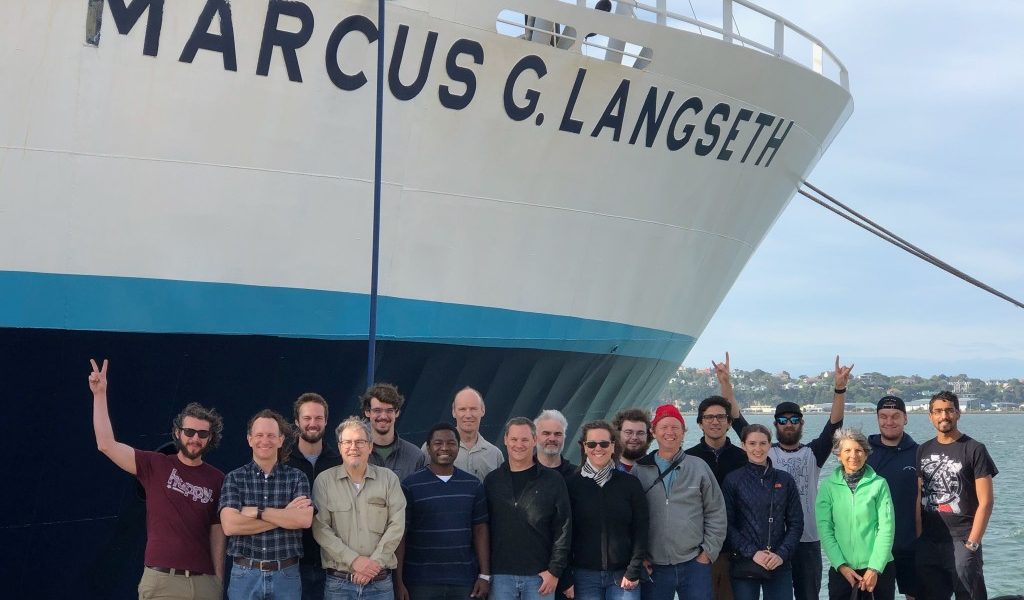
During the first leg of the cruise, the science crew consisted of eight researchers – five PhD students, two postdocs, and our Principal Investigator, Samer Naif, who led this cruise for the first time as Chief Scientist. The crew also included two Scripps EM Lab technicians and two Research Technicians to operate the cranes and supervise our actions on deck, making sure we were following safety protocols. Each twelve-hour shift counted six extremely hardworking individuals. Steady seas and mild to warm weather persisted for the majority of the first cruise, helping us ease into our sea legs and avoid seasickness.

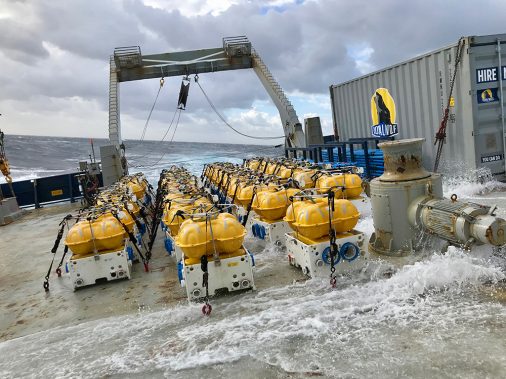
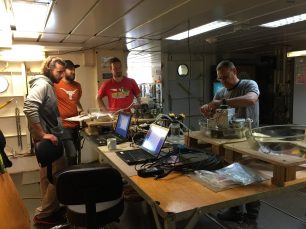
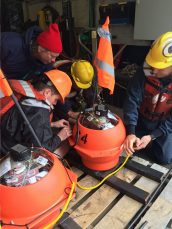
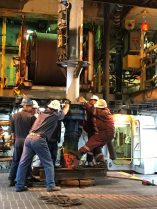
Though we faced noteworthy obstacles in securing each line of CSEM data, the first line has given every one of us an answer to that age old interview question on describing a challenge we overcame. We began by deploying 38 of the Scripps OBEMs in just 24 hours, a nontrivial task as only five members of our entire team had ever assembled these receivers before the cruise. Receivers are the heart and soul of any data collection survey, and the Scripps OBEMs are broadband systems that continuously measure the horizontal components of natural and induced electromagnetic field energy. Such energy propagates through the Earth’s lithosphere in a manner that should depend on its electrical conductivity, which in turn depend in part on variations in fluid content. Proper assembly of the receivers is the first step to ensuring quality data recovery. I appreciated the inexhaustible patience shown by our Scripps EM Lab technicians, Jake Perez and Chris Armerding. From explaining to re-explaining how to use a torque wrench, test the acoustics on our receivers, properly affix electrodes, or attach a concrete block to the base of the receiver, Jake and Chris transformed our group of mostly inexperienced grad students into capable field workers. They showed us the multifaceted usefulness of 3M Scotch 35 electrical tape and cable ties that held electrodes, copper, or wires in place and always seemed to find a home in the pockets of my work pants.

Still jet-lagged and adjusting to twelve hours of manual labor per day, the first line of deployments was the most taxing. Nevertheless, the successful deployment of the receivers provided some reprieve as the next step was to tow our active source instrument, SUESI, the Scripps Undersea Electromagnetic Source Instrument. SUESI’s sharklike body tows behind it both long (~300 m) and short (~10 m) antennas terminated by thirty meter copper electrodes. By attaching SUESI to the ship’s winch using a standard oceanographic 0.680” coaxial deep-tow cable, we can send an alternating electric current from the ship to SUESI. SUESI then rectifies the signal and converts it from high voltage to a high current rectangular waveform that gets injected into the seawater across the copper electrodes. Thus, SUESI’s antennas behave as an EM dipole whose energy propagation can be used to probe the shallow lithosphere. As we started deploying SUESI, Poseidon decided it was time to pay for the nice weather and brisk pace we had enjoyed until then. After the arduous process of assembling, deploying, and lowering SUESI into the depths of the ocean, one of her copper antennas partially snapped. We had to haul SUESI back on board, repair the antenna, and deploy her down into the ocean again, a process that took several hours of deckwork. Hopefully, that was enough excitement to last the entire month. But no. The next day brought with it an inexplicable malfunction that led to yet another retrieval of SUESI. Perhaps she did not like the west Pacific water all that much. Thankfully, our Chief Scientist Samer Naif and lab techs Jake and Chris had planned for the unexpected and brought SUESI’s sister along, as a spare. We had better luck with the second SUESI and ended up relying on her for the remainder of the cruise.

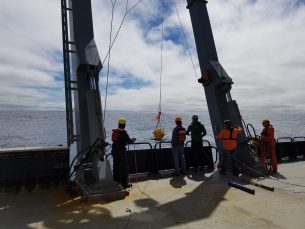
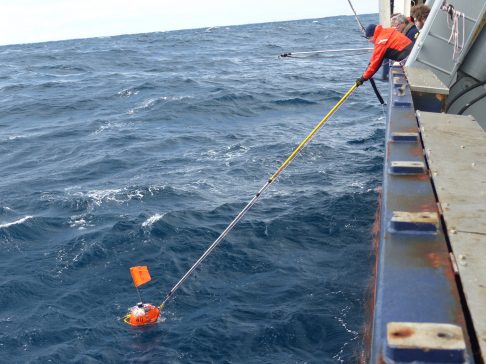
Upon recovering SUESI at the end of the tow, it was time to retrieve the OBEMs to use them for the second line. Even with a heavy concrete block to carry the receivers to the seafloor (Fig. 1), ocean currents can move the OBEMs laterally away from the drop site during their descent through the water column. Once on the seafloor, it is necessary to know the exact location of the OBEM to accurately model the CSEM data. This is achieved by measuring the time it takes for an acoustic pulse sent from the ship to be repeated by the OBEM receiver. Similar to a game of “Marco Polo,” the ship sends and receives these acoustic signals at multiple locations until we have enough information to deduce where the receiver resides. We then send a specially coded acoustic signal to release the OBEM from its concrete block. Once the receiver floats to the surface, the team must act quickly to fish it out of the water. For me, retrieving the surfaced OBEMs was the most nerve wracking part of the process. What if we didn’t throw the grappling hook far enough? What if we couldn’t hook the receiver to the crane? What if the GPS buoy malfunctioned and the receiver couldn’t be located? Despite these worries, we managed to recover every single OBEM that we deployed for CSEM data, not only for the first line but for each of the next three as well – a total of 128 stations.

And what beautiful data we retrieved.

Between steak nights and fish tacos, rom coms and Coen Brothers movies, podcasts on olive oil and speculations about giant squids breaking our instruments, we collected three more lines of CSEM data following a similar routine of deploy-tow-recover. We learned to tie bowlines, clove hitches, and square knots. We watched sunrises, sunsets, witnessed dolphins playing with the bow and participated in safety drills of varying theatrics. And when all was said and done, we would manage to gather 20% more CSEM data than initially planned.

With the CSEM portion of the cruise over, we deployed all 42 OBEMs for the passive source MT portion of the project. Though broadband OBEMs can simultaneously collect CSEM and MT data, we left the receivers on the seafloor for about one month to collect higher quality, long-period MT data. This allowes us to look deeper into the Earth to learn about the lithosphere-asthenosphere system.

The second leg of the cruise in February 2019 involved recovering the OBEMs from the MT deployment phase. This leg included thirteen participants, five of whom were based in New Zealand. Though I did not participate in the second cruise, I was thrilled to hear that all 42 receivers were recovered despite the gnarly weather the team encountered. Taken together with the first cruise, it means a perfect recovery rate for all 170 deployments.

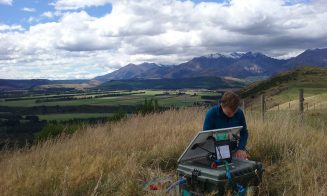
Combined data with the land MT sites collected by GNS Science, New Zealand, this is the largest amphibious EM dataset to date. I am thrilled to be working on this tremendous amount of data for the remainder of my PhD and excited to find what secrets they will unlock about the nature of the Hikurangi margin.

>> It was very educating and fun to work with instruments other than the ones I am used to from my institute. I also took home some ideas for organizing science on research vessels, which might benefit my work group.

– Gesa Franz

>> Even when the waves were high and we could surf in a chair inside the Roger Revelle it was an amazing personal and scientific experience. In my particular case, as a person used to coding and doing mathematics, to do ‘real’ science was very inspiring.

– Julen Alvarez-Aramberri

>> Doing fieldwork at sea gave me a whole new sense of what it means to do science, to be a scientist. It is so much more than analyzing or modeling data on a computer in the mundane safety of an office. We were out on deck in 40 knot winds and six meter seas. Science tests your body and your resolve, not just your mind. Just being on a research vessel dedicated solely to advancing our understanding of our amazing planet was inspiring. And then, of course, there were the sunrises, the stars, and the dolphins.

Daniel Blatter

Reference information
HT-RESIST Hikurangi Trench Regional Electromagnetic Survey to Image the Subduction Thrust. C. Chesley, S. Naif, K. Key
GeoPRISMS Newsletter, Issue No. 42, Spring 2019. Retrieved from http://geoprisms.nineplanetsllc.com

SISIE: South Island Subduction Initiation Experiment


Erin Hightower (Caltech) and Brandon Shuck (UT Austin)

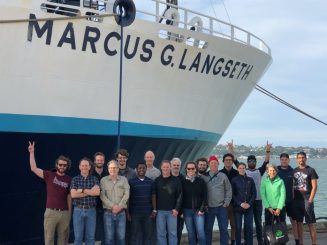
The South Island Subduction Initiation Experiment (SISIE) was an international collaborative active-source seismic survey of the Puysegur subduction margin conducted aboard the R/V Marcus G. Langseth with researchers and graduate students from Caltech, the University of Texas, Texas A&M University, Victoria University of Wellington, and the University of Otago, NZ. The SISIE hopes to further our understanding of the processes controlling subduction initiation, which remains one of the last unsolved problems in plate tectonics. There are many existing hypotheses and models that attempt to quantify and understand these processes, but while many of them are plausible, our ideas far outrun our data. Geodynamic modeling of subduction initiation can only go so far in accurately explaining the mechanics and dynamics of the process. Therefore, without sufficient data to substantiate these models, there is no definitive answer to how subduction zones form.
The Puysegur Trench is part of the Pacific-Australian plate boundary and is a uniquely situated margin for such a survey because it is a young subduction zone with a well-constrained kinematic history that currently appears to be making the transition from a forced to a self-sustaining state, a development that is crucial in ensuring the longevity of a subduction system. The SISIE project aims to test this hypothesis with the marine geophysical data we recently collected. We will use these data to model the crustal structure across the margin, which will play an important role in constraining geodynamic models of subduction initiation.

The SISIE took place from mid-February to late March, 2018 and acquired high-quality geophysical data along and around the Puysegur-Fiordland plate boundary (Fig. 1). As we quickly learned, a research cruise in the Southern Ocean is no easy feat, and twice we had to take shelter from storms and relentless ten-plus meter swells behind Auckland and Stewart islands. We were able to collect multichannel seismic reflection, wide-angle seismic refraction, high-frequency chirp, multibeam bathymetry, magnetic, and gravity data across the margin. Students onboard participated in a daily Marine Geophysics Class, taught by the PIs, which familiarized us with the various data types we were collecting and the tectonic history of New Zealand. By combining theoretical lectures with hands-on applications, the class gave us practical skills in processing and analyzing multibeam and seismic data, which was an invaluable experience.

A total of 28 UTIG ocean-bottom seismometers (OBSs) were deployed on two key transects which span from the subducting Australian plate, across the Puysegur trench and ridge, over the Solander Basin, and onto the Campbell Plateau (Fig. 1). Students were involved with all OBS operations including programming, sealing and mounting, deployment, and recovery of the instruments (Fig. 2). The OBS records show coherent arrivals of crustal and mantle refractions and Moho reflections, and hints of reflections from the subduction interface. These data will help constrain the crustal thickness and seismic velocity structure across the margin, which will help guide gravity modeling.

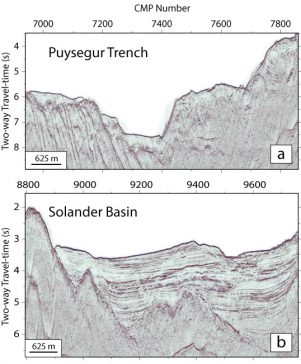
Multichannel seismic (MCS) data were acquired with a 4 or 12 km long streamer, with channels spaced every 12.5 m, and recording airgun shots every 50 m. A standard processing sequence of trace editing, noise suppression, deconvolution, velocity analysis, mute, stacking, post-stack time migration, and multiple suppression was applied, with many of these steps performed as the data were coming in. The resulting subsurface images are of excellent quality, which will allow us to constrain the nature and geometry of the incoming oceanic plate, subduction interface, upper plate faulting, and stratigraphy of the Solander Basin (Fig. 3).

New multibeam bathymetry data provide high-resolution characterization of seafloor features and topography. Gravity and magnetic data obtained throughout the duration of the cruise will also help provide constraints on crustal densities and structure, and detailed estimates of plate ages and their thermal and kinematic histories, supplementing previous datasets for the region. The gravity data in particular will be integrated with the structural surfaces interpreted from the MCS lines and tomography models to develop a comprehensive view of crustal structure that will shed light on the isostatic state of the Puysegur margin and ridge.

The SISIE onshore seismic array was deployed by a small team comprising students from Victoria University of Wellington, GNS Science researchers, and an American student volunteer. The seismographs consisted of five broadbands and 37 short-period instruments deployed in Fiordland and Southland (Fig. 1). The short period array comprises two approximately north-south profiles and one east-west profile across the Winston and Waiau basins, which were designed to line up with several of the MCS lines shot by the Langseth offshore to provide continuous onshore-offshore coverage. The broadbands on the offshore Islands and in those deployed onshore in Fiordland will remain in the field for a year to record earthquakes, a number of which have already been recorded from the Fiordland area. With this array, we hope to record data that elucidates the nature of the crust and the plate geometry beneath southern New Zealand.

The SISIE MCS images are the highest quality data collected in the region, which gives an unprecedented view of the Puysegur subduction zone. In the marine seismic reflection images, we can identify a clear décollement extending from the trench. The image shows some sediment being subducting with the downgoing oceanic plate and some being underplated onto the Pacific plate (Fig. 3a). We were surprised to find stretched continental crust beneath the Solander Basin with the possibility of serpentinized upper mantle (Fig. 3b). Although more work is needed to determine the connection between this stretched crust and the Puysegur subduction system, this is already a major result that likely has great implications for understanding the mechanisms behind subduction initiation. In fact, our preliminary results leave almost no real example of ocean-ocean subduction globally, implying that some component of buoyant continental crust may be necessary for subduction initiation. In the future, we will integrate these data into a more complex and robust geodynamic model of subduction zone formation. SISIE highlights the need to continue marine seismic surveys of subduction margins, especially in areas that are not well explored, and the scientific impact that they bring to our community. Stay tuned for upcoming exciting results from the SISIE researchers and students! ■

References

Mitchell et al, (2012), Undersea New Zealand, 1:5,000,000. NIWA Chart, Miscellaneous Series No. 92.

Reference information
SISIE: South Island Subduction Initiation Experiment 
GeoPRISMS Newsletter, Issue No. 40, Spring 2018. Retrieved from http://geoprisms.nineplanetsllc.com

Assessing changes in the state of a magma storage system over caldera-forming eruption cycles, a case study at Taupo Volcanic Zone, New Zealand


Kari Cooper (UC Davis), Adam Kent (Oregon State University), Chad Deering (Michigan Tech), and collaborator Darren Gravley (University of Canterbury, New Zealand)

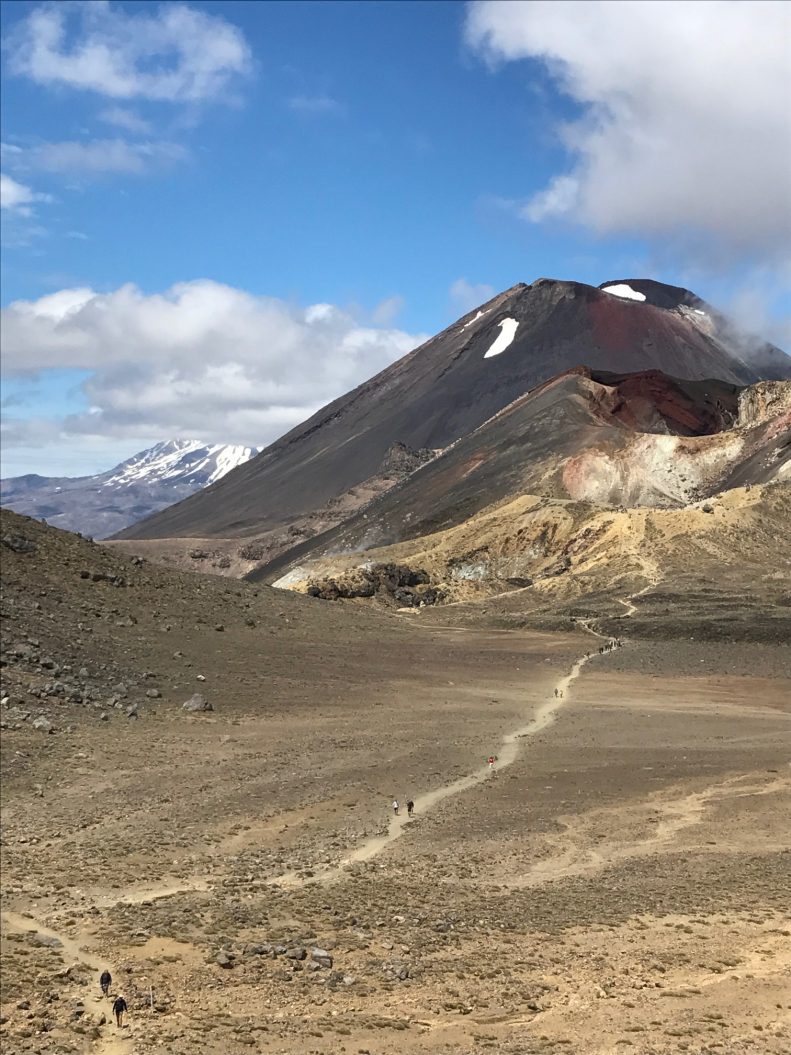
The largest volcanic eruptions are rare events but when they occur can represent a global catastrophe. Relatively small eruptions may still have significant economic impacts (billions of dollars) and may affect the lives and livelihoods of large numbers of people – even in places quite distant from the erupting volcano (e.g., the relatively small Eyjafjallajokull eruption in Iceland in 2010). In an effort to study the processes that lead to large volcanic eruptions in more detail this project focuses on examining the highly active Taupo Volcanic Zone (TVZ) in New Zealand. Our goal is to develop a better understanding of how the temperature and mobility of a magma body below the surface changes before, during, and after a major eruption. As such the project contributes to an emerging understanding of the volcanoes and magmatic processes that can produce such large eruptions, and provides context for interpretation of hazard monitoring at these and other active volcanoes. The project also includes research experience for two K-12 teachers (one in the US and one in New Zealand), and will lead to development of new standard-based physics, chemistry and mathematics curricula.

Our approach is primarily a petrological and geochemical one and will focus on studying full caldera cycles – in addition to studying large eruptions themselves we will also focus on the smaller eruptions that occur before and after major episodes. We will couple age data with compositional data for both crystalline (plagioclase and zircon) and liquid (melt inclusions) parts of the erupted magma at the TVZ to develop constraints on the compositional and thermal variations within magma storage zones prior to eruptions. The project is at an early stage, but we have already compiled preliminary data and conducted a comprehensive sampling campaign during field work in December 2017. The field work was highly successful, bringing together PIs and graduate students from the three US institutions (UC Davis, OSU, and Michigan Tech) with our collaborator at University of Canterbury, along with K-12 science teachers Sara Moilanen (Houghton, MI) and Damien Canney (Christchurch, NZ). Field work also blended sample collection with filming videos of how we conduct field work and brief explanations of volcanic deposits and phenomena, which will be used to develop K-12 course content. The six graduate students in the group (Tyler Schlieder and Elizabeth Grant, UCD; Jordan Lubbers and Nicole Rocco, OSU; Olivia Barbee, MTU; and Lydia Harmon, Vanderbilt Univ.) also maintained a blog on the daily activities of the crew, and participated in the educational videos. The field work also set the stage for monthly video conferences among the graduate students, which helps to maintain coordination between individual thesis projects and the project as a whole.

Moving forward, we will collect a suite of data that will provide the foundation for a novel approach using two primary lines of investigation:

  1. Constraints on the thermal history of pre-eruptive magma storage by coupling absolute ages for plagioclase crystal populations derived from U-series measurements with trace element diffusion models to constrain the maximum residence time of crystals at a given temperature; and
  2. Quantification of the compositional heterogeneity of crystals and melt components, through in-situ measurements of trace-element and isotopic compositions in primary and accessory minerals and in melt inclusions (δ18O in zircon, εHf in zircon; Pb isotopes in plagioclase and melt inclusions), which will provide a measure of the degree to which the magma system is mixed across time and space within the reservoir as well as variations in the contributions of mantle and crustal sources to this reservoir.
  3. The unique strength of this approach is that it will allow simultaneous characterization of the thermal, compositional, and physical evolution of these silicic reservoirs. Therefore, the results of this study should be broadly relevant to other silicic volcanic systems and will represent an important step forward in improving our ability to interpret volcano monitoring data. Large silicic systems represent an end-member for volcanic activity globally, and more general models of the controls on the thermal conditions of magma storage beneath volcanoes will be developed by linking the results of this study with those from other ongoing projects. ■
Reference information
Assessing changes in the state of a magma storage system over caldera-forming eruption cycles, a case study at Taupo Volcanic Zone, New Zealand 
GeoPRISMS Newsletter, Issue No. 40, Spring 2018. Retrieved from http://geoprisms.nineplanetsllc.com

Sizing up the Taniwha: Seismogenesis at Hikurangi Integrated Research Experiment (SHIRE)


Jeff Marshall (Cal Poly Pomona) andJessica Pilarczyk (University of Southern Mississippi)

“A Live Dragon” Beneath the Sea

In Māori culture, the Taniwha is a dragon-like beast that lives beneath the water, sometimes protecting seafarers, while at other times wreaking disaster on coastal communities (King, 2007). Māori lore tells of Taniwha that cause sudden upheavals and changes in the coastline, altering the shape of the land-ocean interface. In the wake of New Zealand’s 2016 Mw7.8 Kaikōura Earthquake, the Taniwha was evoked as a supernatural force behind coastal uplift, tsunami, and landslides (Morton, 2018). For New Zealand, the Hikurangi subduction margin is a formidable Taniwha, a “live dragon” lurking just offshore, ready to unleash powerful forces locked within its seismogenic zone. With multiple collaborative research efforts now underway, geoscientists are shedding light on the habits of this secretive dragon, revealing new understandings of the earthquake and tsunami hazards that threaten New Zealand’s coastline.

The SHIRE Project

The Hikurangi margin along the east coast of New Zealand’s North Island (Fig. 1) provides an optimal venue for investigating megathrust behavior and controls on seismogenesis (e.g., Wallace et al., 2009 and 2014). Along-strike variations in multiple subduction parameters, such as interface coupling, fluid flow, and seafloor roughness, can be linked to observed differences in megathrust slip behavior (seismic vs. aseismic), forearc mass flux (accretion vs. erosion), and upper-plate deformation (contraction vs. extension). Much of the forearc is subaerial and therefore ideal for geodetic and geologic studies, while the submarine areas are easily accessible for geophysical imaging and monitoring. The SHIRE Project, funded by the NSF Integrated Earth Systems (IES) Program, is a four-year, multi-disciplinary, amphibious research effort involving a team of investigators at five US institutions, as well as multiple international collaborators from New Zealand, Japan, and the United Kingdom. This project is designed to evaluate system-level controls on subduction thrust behavior by combining both on and offshore active-source seismic imaging, with onshore paleoseismic, geomorphic, and geodetic investigations. The project results will be meshed with existing geophysical and geological datasets, and analyzed through the lens of state-of-the-art numerical modelling. The overarching goal is to develop an integrated perspective of the physical mechanisms controlling subduction thrust behavior and convergent margin tectonic evolution. Importantly, this perspective will help to elucidate a clearer picture of megathrust earthquake and tsunami hazards along New Zealand’s Hikurangi margin.

The SHIRE Project has three principal components:

Geophysical imaging: Harm van Avendonk (UT Austin) and David Okaya (Univ. of Southern California) are leading the shoreline-crossing geophysical imaging investigations. Marine seismic multi-channel reflection data (MCS) and seismic refraction data recorded by ocean-bottom seismometers (OBSs) are being used to characterize the incoming Hikurangi Plateau, map the structure of the offshore accretionary prism, and document subducted sediment variations. Onshore recordings of offshore airgun shots, explosive shots, and local earthquakes will determine the structure of the upper plate and properties of the deeper plate boundary zone.

Paleoseismology and morphotectonics: Paleoseismic and geomorphic studies led by Jeff Marshall (Cal Poly Pomona) and Jessica Pilarczyk (Univ. of Southern Mississippi) will collect new field data to supplement ongoing coastal tectonics investigations conducted by collaborators at New Zealand’s GNS Science. This integrated data set will help resolve megathrust slip behavior over several seismic cycles, and constrain long-term coastal uplift and subsidence patterns. This component of the project includes a Research Experience for Undergraduates (REU) program, supervised by Marshall, that engages US students in collaborative New Zealand fieldwork.

Numerical Modelling: Demian Saffer (Penn State) and Laura Wallace (UT and GNS Science) will coordinate the integration and analysis of project data through numerical modeling conducted by a team of U.S. and international investigators. The geophysical and geological results will be combined with a range of existing data sets from other projects to constrain numerical models of the physical state of the interface and evolution of the margin over both long and short (seismic cycle) timescales. Model results will also quantify linkages between in situ conditions, fluid flow, behavior of the subduction thrust, and subduction margin development.

SHIRE Spotlight: Geomorphic & Paleoseismic Studies

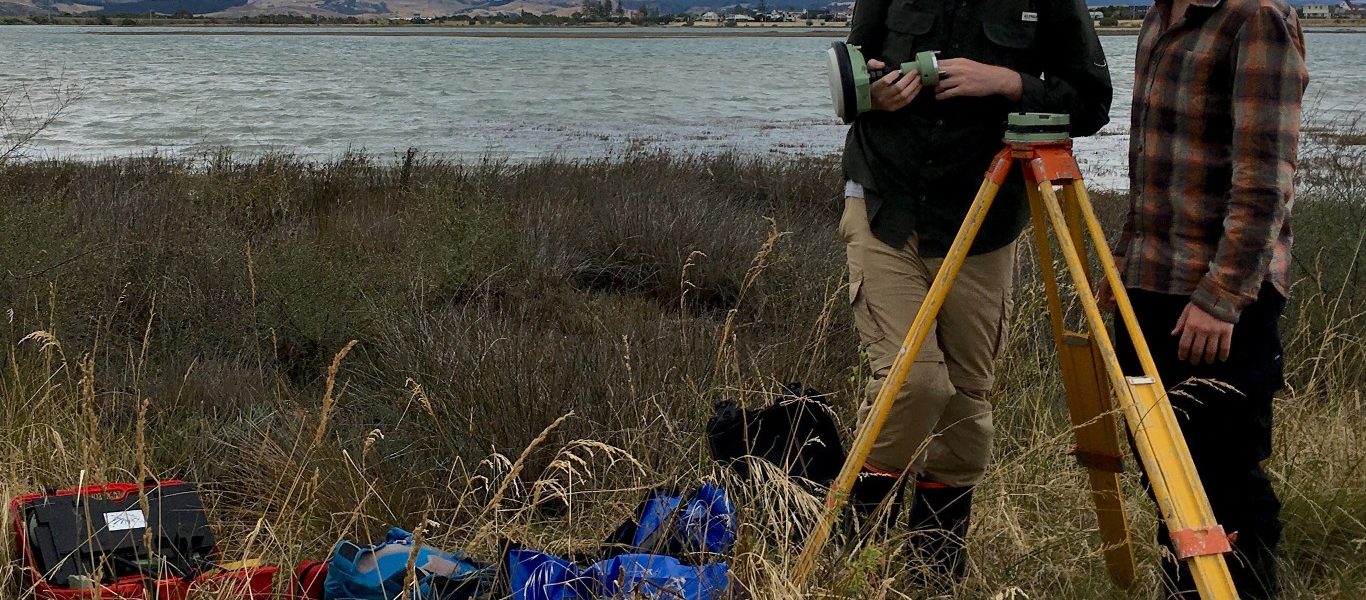
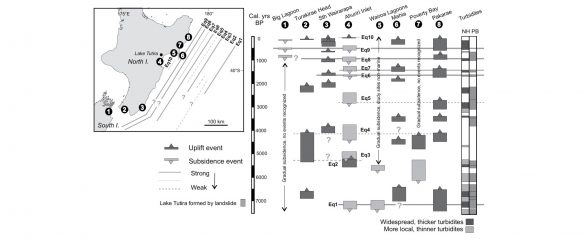
The SHIRE Project’s onshore geomorphic and paleoseismic fieldwork is investigating seismic cycle deformation in the coastal fore arc, focusing on geologic records of land level changes produced by episodes of tectonic uplift and subsidence. Jeff Marshall, Jessica Pilarczyk, and their students are targeting field sites along the North Island east coast (Fig. 2) that compliment ongoing investigations by GNS collaborators Nicola Litchfield, Kate Clark, and Ursula Cochran (e.g., Litchfield et al., 2016; Clark et al., 2015; Cochran et al., 2006). During field seasons in 2017 and 2018, the two research teams conducted parallel studies, with Marshall focused on marine terrace records of coastal uplift, and Pilarczyk on marsh stratigraphic records of subsidence and tsunami.

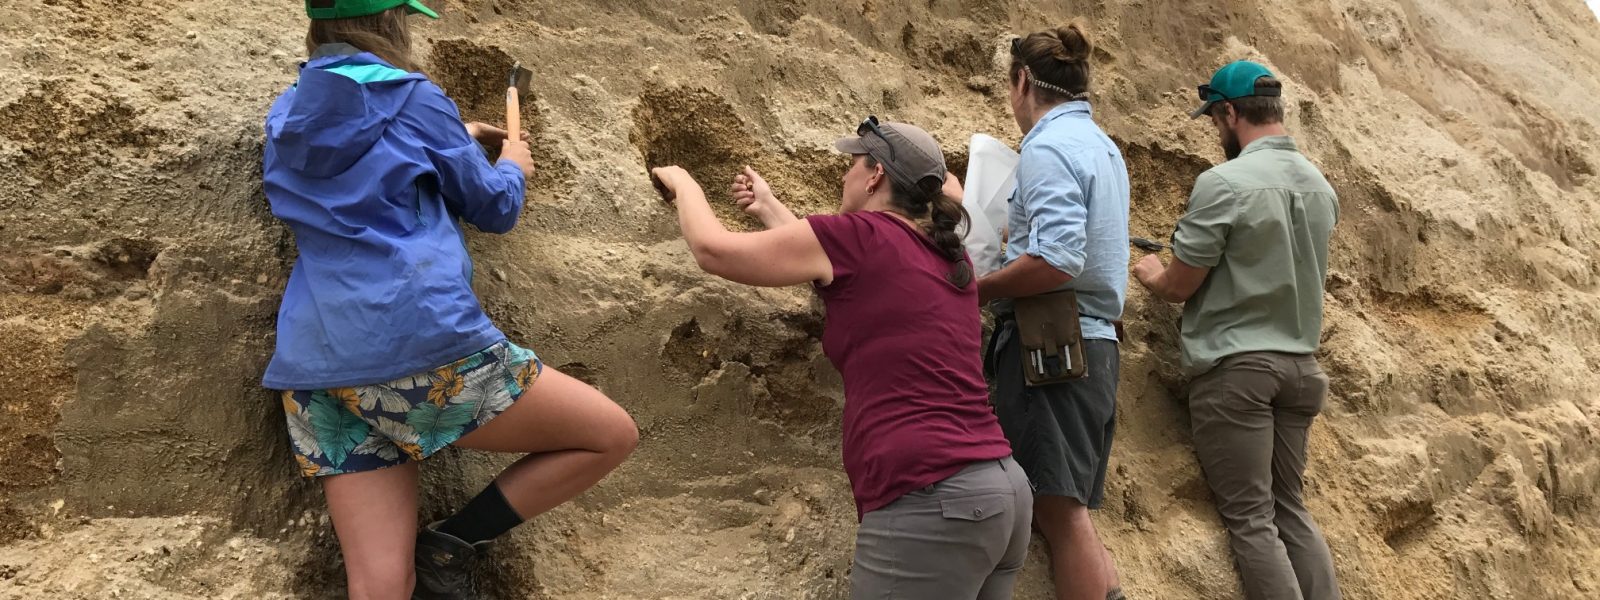
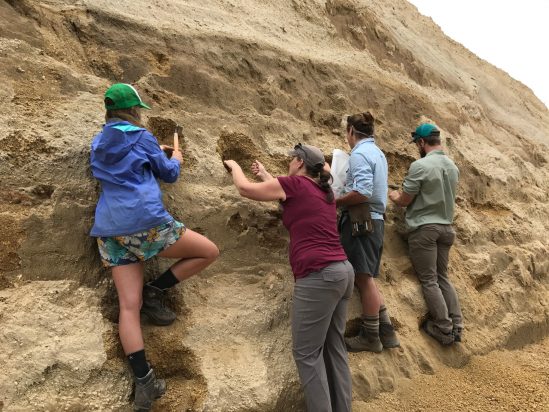
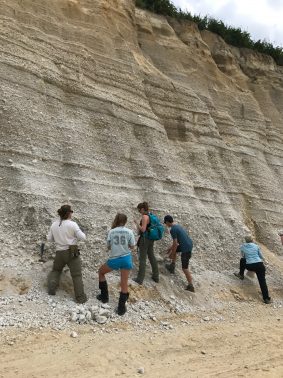
Marshall and students (Fig. 3A-F) are mapping, surveying, and sampling uplifted paleo-shorelines and marine terraces to identify past earthquakes, and to evaluate net coastal uplift patterns. Their efforts focus on several key locations along the Hikurangi margin, including the Raukumaura Peninsula, southern Hawkes Bay, and central Wairarapa coast. Coseismic uplift events are preserved along much of the Hikurangi coastline as elevated paleo-shore platforms and abandoned beach ridges. Marine shells collected from uplifted platforms and overlying beach sediments provide radiocarbon age constraints on prehistoric earthquakes. In addition to localized fieldwork, the Cal Poly Pomona team is using recently acquired airborne LiDAR imagery (provided by GNS) to correlate uplifted paleo-shorelines between field sites (both from this project and prior studies). The LiDAR data incorporates detailed altitude information, which can be used to track lateral variations in terrace uplift along the coast. Marshall and students are also mapping and sampling flights of uplifted Pleistocene marine terraces along the coast to evaluate longer-term fore arc uplift rates and deformation patterns.

Terrace cover beds have been sampled for optically stimulated luminescence (OSL) geochronology, and for the identification of volcanic tephra and loess deposits of known ages. During the next two years, terrace mapping and sampling will be expanded to new areas and drone imagery will be recorded for structure-from-motion studies. Project students will conduct digital terrain analyses using regional topographic data to evaluate net deformation patterns, calculate morphometric indices, and outline morphotectonic domains. Overall, the efforts of the coastal uplift team will provide new constraints on the timing and spatial distribution of both short-term seismic cycle events, as well as longer-term cumulative deformation.

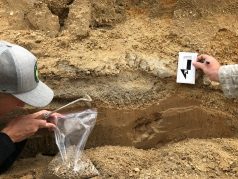
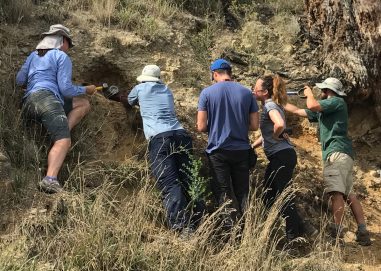
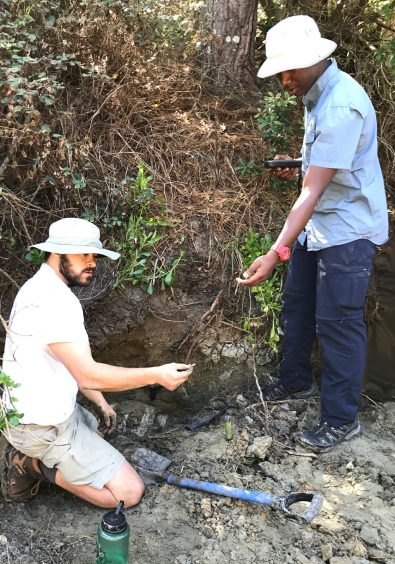
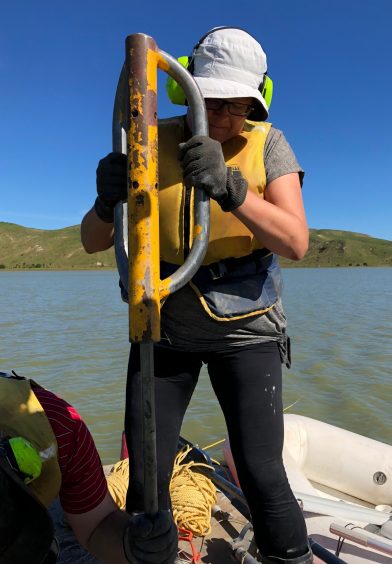
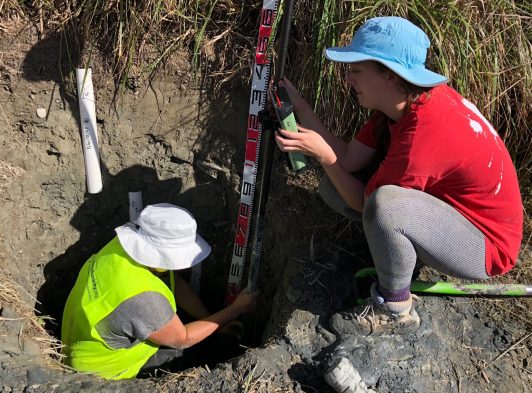
Pilarczyk and students (Fig. 3 G-I) are using coastal sediments to develop long-term records of Hikurangi earthquakes and tsunamis. Microfossils such as foraminifera are used to recognize both subtle and abrupt changes in sea level along a coastline. An abrupt change in sea level, caused by coseismic subsidence, indicates the occurrence of an earthquake and can be recognized along the coastline as a soil buried beneath subtidal sediments. Because certain microfossils have fidelity to the tidal frame, they can be used to assess how much a coastline subsided during an earthquake. They can also be used to identify tsunami deposits because they indicate transport of marine sediment into a coastal setting where such sediment does not occur naturally. In this way, radiocarbon dating and microfossil analysis on coastal sediments can be used to understand the timing and magnitude of past Hikurangi earthquakes and tsunamis. In 2017 and 2018, Pilarczyk and students embarked on a sediment coring campaign that targeted low-energy depositional centers (i.e., marshes, lagoons) along the Hawke’s Bay coastline. Their mission was to find evidence for past Hikurangi earthquakes that would supplement the short-term observational record by expanding the age range of known events to include centennial and millennial timescales. The team’s ongoing investigations have led to the identification of newly discovered events that will help to better understand the seismic hazard for coastlines facing the Hikurangi margin. ■

References

Clark, K.J., B.W. Hayward, U.A. Cochran, L.M. Wallace, W.L. Power, A.T. Sabaa, (2015), Evidence for past subduction earthquakes at a plate boundary with widespread upper plate faulting: Southern Hikurangi Margin, New Zealand. Bull. Seismol. Soc. Am., 105. doi: 10.1785/0120140291
Cochran, U., K. Berryman, J. Zachariasen, D. Mildenhall, B. Hayward, K. Southall, C. Hollis, P. Barker, L.M. Wallace, B. Alloway, K. Wilson, (2006), Paleoecological insights into subduction zone earthquake occurrence, eastern North Island, New Zealand. Geol Soc Am Bull, 118, 1051-1074, doi:10.1130/B25761.1
Hayward, B.W., H.R. Grenfell, A.T. Sabaa, U.A. Cochran, K.J. Clark, L.M. Wallace, A.S. Palmer, A.S., (2016), Salt-marsh foraminiferal record of 10 large Holocene (last 7500 yr) earthquakes on a subducting plate margin, Hawkes Bay, New Zealand: Geological Society of America Bulletin, v.128, p. 896-915, doi:10.1130/B31295.1
King, D.N.T., J. Goff, A. Skipper, (2007), Māori environmental knowledge and natural hazards in Aotearoa-New Zealand. Journal of the Royal Society of New Zealand, 37, 59-73, doi.org/10.1080/03014220709510536.
Litchfield, N.J., U.A. Cochran, K.R. Berryman, K.J. Clark, B.G. McFadgen, R. Steele, (2016), Gisborne seismic and tsunami hazard: Constraints from marine terraces at Puatai Beach GNS Science Report 2016-21, 99
Morton, J., (2018), Our sleeping Taniwha: Hikurangi’s tsunami threat. New Zealand Herald, 10 March 2018, https://www.nzherald.co.nz
Wallace, L.M., M. Reyners, U. Cochran, S. Bannister, P.M. Barnes, K. Berryman, G. Downes, D. Eberhart-Phillips, A. Fagereng, S. Ellis, A. Nicol, R. McCaffrey, R.J. Beavan, S. Henrys, R. Sutherland, D.H.N. Barker, N. Litchfield, J. Townend, R. Robinson, R. Bell, K. Wilson, W. Power, (2009), Characterizing the seismogenic zone of a major plate boundary subduction thrust: Hikurangi Margin, New Zealand. Geochem Geophys Geosyst, 10, Q10006. doi:10010.11029/12009GC002610
Wallace, L.M., U.A. Cochran, W.L. Power, K.J. Clark, (2014), Earthquake and tsunami potential of the Hikurangi subduction thrust, New Zealand insight from paleoseismology, GPS, and tsunami modelling. Oceanography, 27, 104-117. doi:10.5670/oceanog.2014.46

Reference information
Sizing up the Taniwha: Seismogenesis at Hikurangi Integrated Research Experiment (SHIRE)
GeoPRISMS Newsletter, Issue No. 40, Spring 2018. Retrieved from http://geoprisms.nineplanetsllc.com

Hikurangi Ocean Bottom Investigation of Tremor and Slow Slip (HOBITSS) – Revealing the environment of shallow slow slip


Susan Schwartz (UC Santa Cruz), Anne Sheehan (University Colorado, Boulder), Rachel Abercrombie (Boston University)

In the last fifteen years, it has become evident that slow slip events (SSEs) are a common and important part of the subduction process. They produce millimeters to centimeters of surface displacement over days to years that can be measured by geodesy and are often accompanied by seismic tremor and earthquake swarms. Slow slip and tremor have been observed in subduction zones in Cascadia, Japan, Mexico, Alaska, Ecuador, northern Peru, Costa Rica and New Zealand.

The 2014-15 HOBITSS deployment of 24 ocean bottom pressure sensors and fifteen ocean bottom seismometers (OBSs) at the northern Hikurangi margin, New Zealand captured a M7.0 SSE. The vertical deformation data collected were used to image one of the best-resolved slow slip distributions to date, and indicated slip very close, if not all the way to the trench (Wallace et al., 2016). The Fall 2016 GeoPRISMS Newsletter reported on this experiment and how for the first time, ocean bottom pressure recorders successfully mapped a SSE displacement field (Wallace et al., 2016). The HOBITSS results were instrumental in demonstrating that Absolute Pressure Gauges are a valuable tool for seafloor geodesy. Seismologists from UC Santa Cruz, University of Colorado Boulder and Boston University are now using the seismic data collected during the same experiment to evaluate the spatiotemporal relationship between seismicity (both earthquakes and tremor) and the slow slip event and the role that seismic structure plays in controlling slip behavior. One of our primary goals is to determine if slow and fast interplate slip modes spatially overlap or are segregated.

An initial catalog of local earthquakes was constructed and relocated in a New Zealand-derived velocity model to produce a catalog of 2,619 earthquakes ranging in magnitude between 0.5 and 4.7. Locations indicate that Hikurangi seismicity is concentrated in two NE-SW bands, one offshore beneath the Hikurangi trough and outer forearc wedge, and one onshore beneath the eastern Raukumara Peninsula, with a gap in seismicity between the two beneath the inner forearc wedge. We do not find an increase in seismicity during the 2014 slow slip event, though seismicity is slightly higher in the month following the SSE. The majority of earthquakes are within the subducting slab rather than at the plate interface. The few events that locate close to the plate interface were assumed to be thrust events and used as templates in a waveform matching technique to identify similarly located earthquake swarms within the entire dataset.

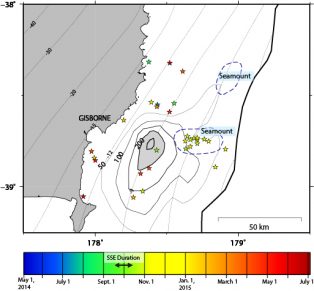
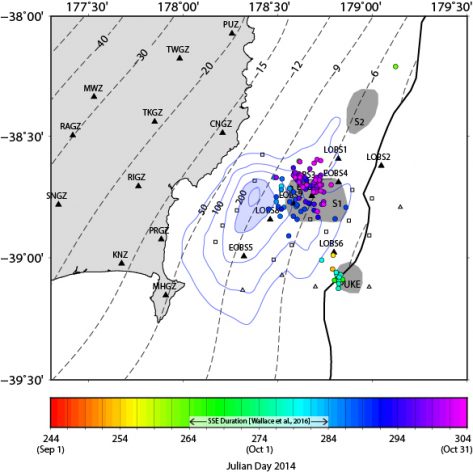
Like the general seismicity increase in the month following the SSE, repeating families of interplate events (Fig. 1) also cluster in time at the end of the SSE. They are spatially concentrated within the slow slip patch and associated with a well-imaged subducted seamount (Bell et al., 2010).

Tectonic tremor was also identified toward the end and continuing after the slow slip event. Like the interplate earthquake families, tremor is also co-located with slow slip and localized in the vicinity of subducted seamounts (Fig. 2). The subsequent, rather than synchronous occurrence of tremor and interplate earthquakes and slow slip suggests that seamount subduction plays the dominant role in the stress state of the shallow megathrust. While northern Hikurangi seamounts appear to primarily subduct aseismically, their subduction may generate elevated pore-fluid pressures in accumulated underplated sediment packages and a complex, interconnected fracture network such that tremor and microseismicity occur as seismic components of seamount subduction during shallow slow slip. This study indicates that the location of subducted seamounts is strongly correlated with the distribution of SSE-associated tectonic tremor and repeating earthquakes. The seamounts appear to be responsible for slow slip, tremor, and microseismicity rupturing adjacent regions in a range of slip processes.

Ongoing work more fully utilizes the rich data set of local earthquakes and includes analysis of seismic attenuation using the body wave spectra of local earthquakes, local earthquake seismic velocity tomography, and earthquake source parameter analysis including focal mechanisms and seismic moment. Knowing the physical state of the subducting plate interface is important for the slow slip modeling, and our attenuation and velocity tomography models will be key to infer the physical properties and structure in the area where slow slip occurs. For example, recent work revealed large differences between SSE slip inversions that assume homogeneous elastic properties versus those that utilize a more realistic elastic structure (Williams and Wallace, 2015). ■

References

Bell, R., R. Sutherland, D.H.N. Barker, S. Henrys, S. Bannister, L.M. Wallace, J. Beavan, (2010), Seismic reflection character of the Hikurangi subduction interface, New Zealand, in the region of repeated Gisborne slow slip events. Geophys. J. Int., 180(1), 34–48. doi.org/10.1111/j.1365-246X.2009.04401.x
Wallace, L.M., S.C. Webb, Y. Ito, K. Mochizuki, R. Hino, S. Henrys, S., Schwartz, A.F. Sheehan, (2016), Slow slip near the trench at the Hikurangi subduction zone, New Zealand. Science, 352(6286), 701–704. doi.org/10.1126/science.aaf2349
Williams, C.A., L.M. Wallace, (2015), Effects of material property variations on slip estimates for subduction interface slow slip events, Geophys. Res. Lett., 42(2), 1113-1121. doi.org/10.1016/j.epsl.2018.01.002

Reference information
Hikurangi Ocean Bottom Investigation of Tremor and Slow Slip (HOBITSS) – Revealing the environment of shallow slow slip
GeoPRISMS Newsletter, Issue No. 40, Spring 2018. Retrieved from http://geoprisms.nineplanetsllc.com

IODP tackles the Hikurangi Margin of New Zealand with two drilling expeditions to unlock the secrets of slow-slip events


MGL1801 Participants – Ryuta Aral (JAMSTEC), Stephen Ball (Univ. of Wisconsin, Madison), Nathan Bangs (UT Austin), Dan Barker (GNS Science), Joel Edwards (UC Santa Cruz), Melissa Gray (Imperial College London), Shuoshuo Han (UT Austin), Harold Leah (Cardiff Univ.), Tim Reston (Univ. of Birmingham), Hannah Tilley (Univ of Hawai’i), and Harold Tobin (Univ. of Wisconsin, Madison)

When the Pacific plate slips beneath the Australian plate along the northern Hikurangi margin, the subduction megathrust does not typically generate earthquakes as it often does in subduction zones. Instead, stress accumulated on the megathrust is released within patches every 2-4 years over a period of weeks in well documented slow slip events (SSEs) (i.e. Wallace and Bevean, 2010). While SSEs are not unique to the Hikurangi margin, SSEs often occur at depths of 30-40 km down dip of the seismogenic zone. This makes them difficult to access and thus difficult to examine the physical conditions that control whether the megathrust slips quickly in regular earthquakes or instead slips slowly. However, the Hikurangi margin has documented regular patterns of SSEs that extend updip along the megathrust to unusually shallow depths of ~2 km below the seafloor. This unusually shallow setting and the well documented distribution of slip makes these SSEs accessible with geophysical tools and even drilling.

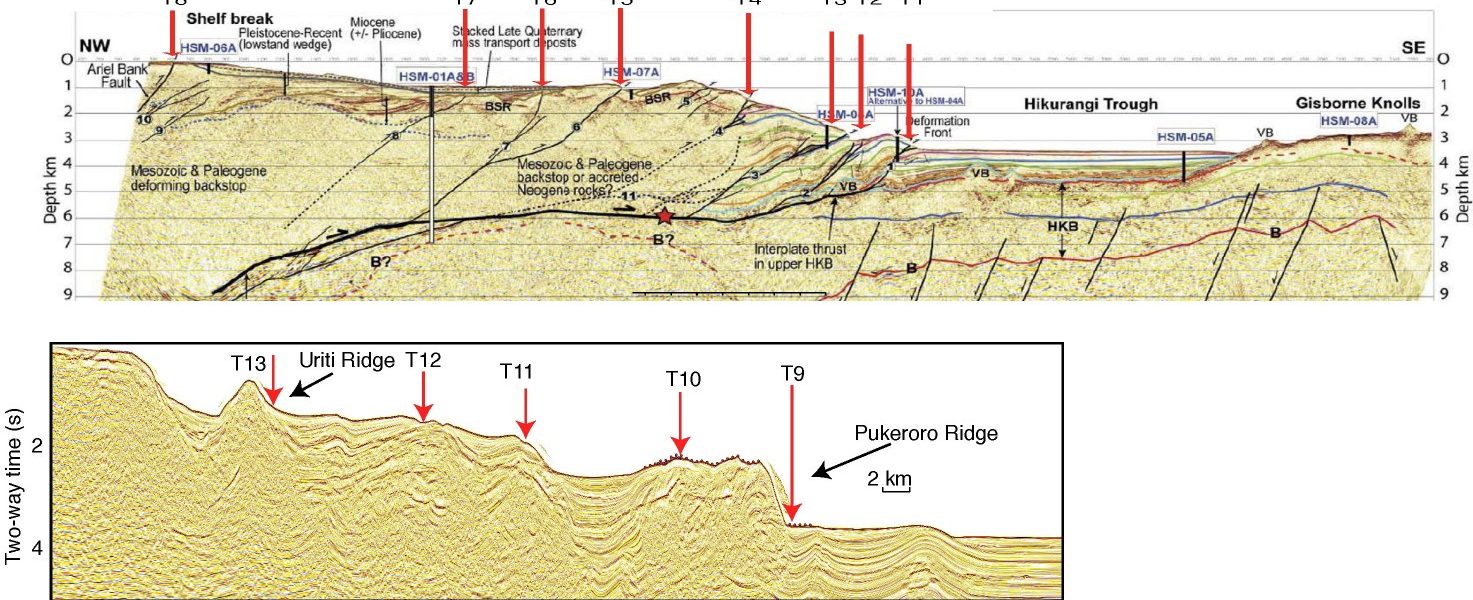
From January 6th to February 9th 2018, a team of marine geologists and geophysicists from the US, UK, Japan, and New Zealand sailed on the R/V Langseth to acquire a new 3D seismic reflection data volume across the northern Hikurangi margin offshore of the North Island of New Zealand (Fig. 1). Previous seismic surveys have imaged the subsurface structures and offered hints into the unusual megathrust slip behavior along the Hikurangi margin. Bell et al. (2010) showed large seamounts on the subducting plate that can generate thrust faults within the upper plate, and entrain fluid rich sediments and carry them below the megathrust deep into the subduction zone. It is these impacts on the shallow subduction zone that are thought to generate conditions for high fluid content along the megathrust and fluid migration pathways from the megathrust through the upper plate. It is this fluid supply and flow system that is thought to lead to high fluid pressures and control effective stresses along the megathrust, which are also considered critical controls for slip behavior (Saffer and Wallace, 2015). However, it was also evident from earlier 2D seismic images that this complex setting required 3D data to correctly image the shallow megathrust and upper plate structures. Such high resolution 3D data can map out fluid content and faults to fully characterize this system.

The NZ3D experiment was designed to acquire 3D seismic images to map reflectivity and structures, and it provided an opportunity for a novel wide-angle seismic reflection and refraction component to measure seismic velocities in unprecedented detail and in 3D using full waveform inversion (FWI). The detailed seismic velocity data will reveal rock physical properties and will complement observations of reflectivity and structural geometry seen in 3D seismic images.

In most years this large ambitious geophysical experiment would by itself be a major achievement for any given site; however, the NZ3D project was designed to contribute to larger efforts on the New Zealand primary site that included: The NSF-funded SHIRE active source experiment (Nov–Dec 2017) to examine the crustal scale structure of the Hikurangi margin using ocean bottom seismometers, onland seismic receiver stations, and 2D seismic reflection imaging (p.22); IODP drilling to recover core samples, measure physical properties, and install observatories – Expeditions 372 (Nov 2017–Jan 2018) and 375 (Mar–Apr 2018) (p.16); and other related studies.

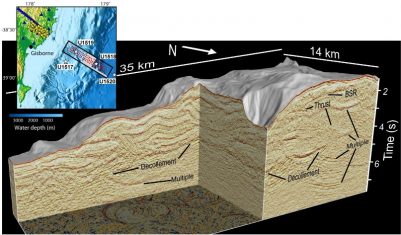
During the Langseth cruise we surveyed an area 14 x 60 km from the trench to the shelf across the Expedition 375 drilling transect (Fig. 1). Langseth fired one of two 3,300 in3 airgun arrays every 25 m in flip-flop mode and recorded returns on four 6-km-long, 468-channel seismic streamers spaced at 150 m. We made 62 passes through the survey area, fired 145,924 shots and recorded over 5Tbytes of seismic reflection data. With calm seas during most of the 35 days at sea, few equipment issues, and very few interruptions from protected species, we acquired a high-quality seismic data volume that will enable us to examine reflectivity of the megathrust down to more than 10 km in the area of SSEs and map the geometry of faults and stratigraphic horizons. In order to acquire the data needed for FWI, in December 2017, prior to NZ3D acquisition, the R/V Tangaroa deployed a hundred ocean bottom seismometers (OBSs) provided by JAMSTEC in a randomized grid with nominal 2 x 2 km spacing (Fig. 1). Shots for FWI were also recorded on stations deployed around the Gisborne area specifically for NZ3D and stations that had been deployed initially for SHIRE and remained for NZ3D (Fig. 1). A total of almost 300 onland stations recorded Langseth shots during NZ3D. We were also able to take advantage of the close line spacing during the 3D survey to increase the resolution of multibeam bathymetry and backscatter images across the margin. These data provide some of the best detail of the northern Hikurangi margin seafloor to date.

From here, we will spend the next few years processing the 3D volume (with emphasis on water column multiple removal) and OBS data sets to produce high-quality, detailed 3D images in depth, seismic velocity data, and interpret these results in the context of new results from the coordinated projects. Structures in 3D are already emerging from preliminary results (Fig. 1) and are only going to get better. There are lots of exciting results to come for studies of slow slip along the Hikurangi megathrust. ■

References

Araki, E., D.M. Saffer, A. Kopf, L.M. Wallace, T. Kimura, Y. Machida, S. Ide, (2017), Recurring and triggered slow slip events near the trench at the Nankai Trough subduction megathrust. Science, 356, 1157-1160. doi: 10.1126/science.aan3120
Barker, D.H.N., R. Sutherland, S. Henrys, S. Bannister, (2009), Geometry of the Hikurangi subduction thrust and upper plate, North Island, New Zealand. Geochem Geophys Geosyst, 10(2), Q02007. doi.org/10.1029/2008GC002153
Bell, R., R. Sutherland, D.H.N. Barker, S. Henrys, S. Bannister, L.M. Wallace, J. Beavan, (2010), Seismic reflection character of the Hikurangi subduction interface, New Zealand, in the region of repeated Gisborne slow slip events. Geophys. J. Int., 180(1), 34–48. doi.org/10.1111/j.1365-246X.2009.04401.x
Chang, C., L.C. McNeill, J.C. Moore, W. Lin, M. Conin, Y. Yamada, (2010), In situ stress state in the Nankai accretionary wedge estimated from borehole wall failures. Geochem Geophys Geosyst, 11:Q0AD04. doi.org/10.1029/2010GC003261
Davy, B., K. Hoernle, R. Werner, (2008), Hikurangi Plateau: crustal structure, rifted formation, and Gondwana subduction history. Geochem Geophys Geosyst, 9(7):Q07004. doi.org/10.1029/2007GC001855
Hensen, C., K. Wallmann, M. Schmidt, C.R. Ranero, E. Suess, (2004), Fluid expulsion related to mud extrusion off Costa Rica—a window to the subducting slab. Geology, 32(3), 201–204. doi.org/10.1130/G20119.1
Huffman, K.A., D.M. Saffer, (2016), In situ stress magnitudes at the toe of the Nankai Trough Accretionary Prism, offshore Shikoku Island, Japan. J. Geophys. Res.: Solid Earth, 121(2), 1202–1217. doi.org/10.1002/2015JB012415
Jannasch, H.W., C.G. Wheat, J.N. Plant, M. Kastner, D.S. Stakes, (2004), Continuous chemical monitoring with osmotically pumped water samplers: OsmoSampler design and applications. Limnology and Oceanography: Methods, 2(2), 102–113.
Kopf, A., G. Mora, A. Deyhle, S. Frape, R. Hesse, (2003), Fluid geochemistry in the Japan Trench forearc (ODP Leg 186): a synthesis. In Suyehiro, K., Sacks, I.S., Acton, G.D., and Oda, M. (Eds.), Proceedings of the Ocean Drilling Program, Scientific Results, 186: College Station, TX (Ocean Drilling Program), 1–23. doi.org/10.2973/odp.proc.sr.186.117.2003
Pecher, I.A., P.M. Barnes, L.J. LeVay, and the Expedition 372 Scientists, (2018), IODP Expedition 372 Preliminary Report, Creeping Gas Hydrate Slides and Hikurangi LWD. College Station, TX (International Ocean Discovery Program). doi.org/10.14379/iodp.pr.372.2018
Pedley, K.L., P.M. Barnes, J.R. Pettinga, K.B. Lewis, (2010), Seafloor structural geomorphic evolution of the accretionary frontal wedge in response to seamount subduction, Poverty Indentation, New Zealand. Marine Geology, 270(1–4), 119–138. doi.org/10.1016/j.margeo.2009.11.006
Peng, Z., J. Gomberg, (2010), An integrated perspective of the continuum between earthquakes and slow-slip phenomena. Nat. Geosci., 3(9), 599–607. doi.org/10.1038/ngeo940
Ranero, C.R., I. Grevemeyer, U. Sahling, U. Barckhausen, C. Hensen, K. Wallmann, W. Weinrebe, P. Vannucchi, R. von Huene, K. McIntosh, (2008), Hydrogeological system of erosional convergent margins and its influence on tectonics and interplate seismogenesis. Geochem Geophys Geosyst, 9(3), Q03S04. doi.org/10.1029/2007GC001679
Saffer, D.M., L.M. Wallace, (2015), The frictional, hydrologic, metamorphic and thermal habitat of shallow slow earthquakes. Nat. Geosci., 8(8), 594–600. doi.org/10.1038/ngeo2490
Saffer, D.M., L.M. Wallace, K. Petronotis, (2017), Hikurangi subduction margin coring and observatories: unlocking the secrets of slow slip through drilling to sample and monitor the forearc and subducting plate. International Ocean Discovery Program Expedition 375 Scientific Prospectus: College Station, TX (International Ocean Discovery Program). doi.org/10.14379/iodp.sp.375.2017
Saffer, D.M., M.B. Underwood, A.W. McKiernan, (2008), Evaluation of factors controlling smectite transformation and fluid production in subduction zones: application to the Nankai Trough. Island Arc, 17(2), 208–230. doi.org/10.1111/j.1440-1738.2008.00614.x
Schwartz, S.Y., J.M. Rokosky, (2007), Slow slip events and seismic tremor at circum-Pacific subduction zones. Reviews of Geophysics, 45:RG3004. doi.org/10.1029/2006RG000208
Solomon, E.A., M. Kastner, C.G. Wheat, H. Jannasch, G. Robertson, E.E. Davis, J.D. Morris, (2009), Long-term hydrogeochemical records in the oceanic basement and forearc prism at the Costa Rica subducti. Earth Planet. Sci. Lett., 282, 240–251. doi.org/10.1016/j.epsl.2009.03.022
Wallace, L.M., J. Beavan, (2010), Diverse slow slip behavior at the Hikurangi subduction margin, New Zealand. J. Geophys. Res.: Solid Earth, 115(B12):B12402. doi.org/10.1029/2010JB007717
Wallace, L.M., J. Beavan, R. McCaffrey, D. Darby, (2004), Subduction zone coupling and tectonic block rotations in the North Island, New Zealand. J. Geophys. Res.: Solid Earth, 109(B12):B12406. doi.org/10.1029/2004JB003241
Wallace, L.M., S.C. Webb, Y. Ito, K. Mochizuki, R. Hino, S. Henrys, S.Y. Schwartz, A.F. Sheehan, (2016), Slow slip near the trench at the Hikurangi subduction zone, New Zealand. Science, 352(6286), 701–704. doi.org/10.1126/science.aaf2349
Wallace, L.M., Y. Kaneko, S. Hreinsdottir, I. Hamling, Z. Peng, N. Bartlow, E. D’Anastasio, and B. Fry, (2017), Large-scale dynamic triggering of shallow slow slip enhanced by overlying sedimentary wedge. Nat. Geosci., 10, 765–770. doi: 10.1038/ngeo3021
Wech, A.G., K.C. Creager, (2011), A continuum of stress, strength and slip in the Cascadia subduction zone. Nat. Geosci., 4(9), 624–628. doi.org/10.1038/ngeo1215

Reference information
IODP tackles the Hikurangi Margin of New Zealand with two drilling expeditions to unlock the secrets of slow-slip events
GeoPRISMS Newsletter, Issue No. 40, Spring 2018. Retrieved from http://geoprisms.nineplanetsllc.com

The NZ3D Experiment – Adding a new dimension for understanding slow slip events


MGL1801 Participants – Ryuta Aral (JAMSTEC), Stephen Ball (Univ. of Wisconsin, Madison), Nathan Bangs (UT Austin), Dan Barker (GNS Science), Joel Edwards (UC Santa Cruz), Melissa Gray (Imperial College London), Shuoshuo Han (UT Austin), Harold Leah (Cardiff Univ.), Tim Reston (Univ. of Birmingham), Hannah Tilley (Univ of Hawai’i), and Harold Tobin (Univ. of Wisconsin, Madison)

When the Pacific plate slips beneath the Australian plate along the northern Hikurangi margin, the subduction megathrust does not typically generate earthquakes as it often does in subduction zones. Instead, stress accumulated on the megathrust is released within patches every 2-4 years over a period of weeks in well documented slow slip events (SSEs) (i.e. Wallace and Bevean, 2010). While SSEs are not unique to the Hikurangi margin, SSEs often occur at depths of 30-40 km down dip of the seismogenic zone. This makes them difficult to access and thus difficult to examine the physical conditions that control whether the megathrust slips quickly in regular earthquakes or instead slips slowly. However, the Hikurangi margin has documented regular patterns of SSEs that extend updip along the megathrust to unusually shallow depths of ~2 km below the seafloor. This unusually shallow setting and the well documented distribution of slip makes these SSEs accessible with geophysical tools and even drilling.

From January 6th to February 9th 2018, a team of marine geologists and geophysicists from the US, UK, Japan, and New Zealand sailed on the R/V Langseth to acquire a new 3D seismic reflection data volume across the northern Hikurangi margin offshore of the North Island of New Zealand (Fig. 1). Previous seismic surveys have imaged the subsurface structures and offered hints into the unusual megathrust slip behavior along the Hikurangi margin. Bell et al. (2010) showed large seamounts on the subducting plate that can generate thrust faults within the upper plate, and entrain fluid rich sediments and carry them below the megathrust deep into the subduction zone. It is these impacts on the shallow subduction zone that are thought to generate conditions for high fluid content along the megathrust and fluid migration pathways from the megathrust through the upper plate. It is this fluid supply and flow system that is thought to lead to high fluid pressures and control effective stresses along the megathrust, which are also considered critical controls for slip behavior (Saffer and Wallace, 2015). However, it was also evident from earlier 2D seismic images that this complex setting required 3D data to correctly image the shallow megathrust and upper plate structures. Such high resolution 3D data can map out fluid content and faults to fully characterize this system.

The NZ3D experiment was designed to acquire 3D seismic images to map reflectivity and structures, and it provided an opportunity for a novel wide-angle seismic reflection and refraction component to measure seismic velocities in unprecedented detail and in 3D using full waveform inversion (FWI). The detailed seismic velocity data will reveal rock physical properties and will complement observations of reflectivity and structural geometry seen in 3D seismic images.

In most years this large ambitious geophysical experiment would by itself be a major achievement for any given site; however, the NZ3D project was designed to contribute to larger efforts on the New Zealand primary site that included: The NSF-funded SHIRE active source experiment (Nov–Dec 2017) to examine the crustal scale structure of the Hikurangi margin using ocean bottom seismometers, onland seismic receiver stations, and 2D seismic reflection imaging (p.22); IODP drilling to recover core samples, measure physical properties, and install observatories – Expeditions 372 (Nov 2017–Jan 2018) and 375 (Mar–Apr 2018) (p.16); and other related studies.

During the Langseth cruise we surveyed an area 14 x 60 km from the trench to the shelf across the Expedition 375 drilling transect (Fig. 1). Langseth fired one of two 3,300 in3 airgun arrays every 25 m in flip-flop mode and recorded returns on four 6-km-long, 468-channel seismic streamers spaced at 150 m. We made 62 passes through the survey area, fired 145,924 shots and recorded over 5Tbytes of seismic reflection data. With calm seas during most of the 35 days at sea, few equipment issues, and very few interruptions from protected species, we acquired a high-quality seismic data volume that will enable us to examine reflectivity of the megathrust down to more than 10 km in the area of SSEs and map the geometry of faults and stratigraphic horizons. In order to acquire the data needed for FWI, in December 2017, prior to NZ3D acquisition, the R/V Tangaroa deployed a hundred ocean bottom seismometers (OBSs) provided by JAMSTEC in a randomized grid with nominal 2 x 2 km spacing (Fig. 1). Shots for FWI were also recorded on stations deployed around the Gisborne area specifically for NZ3D and stations that had been deployed initially for SHIRE and remained for NZ3D (Fig. 1). A total of almost 300 onland stations recorded Langseth shots during NZ3D. We were also able to take advantage of the close line spacing during the 3D survey to increase the resolution of multibeam bathymetry and backscatter images across the margin. These data provide some of the best detail of the northern Hikurangi margin seafloor to date.

From here, we will spend the next few years processing the 3D volume (with emphasis on water column multiple removal) and OBS data sets to produce high-quality, detailed 3D images in depth, seismic velocity data, and interpret these results in the context of new results from the coordinated projects. Structures in 3D are already emerging from preliminary results (Fig. 1) and are only going to get better. There are lots of exciting results to come for studies of slow slip along the Hikurangi megathrust. ■

References

Bell, R., R. Sutherland, D.H.N. Barker, S. Henrys, S. Bannister, L.M. Wallace, J. Beavan, (2010), Seismic reflection character of the Hikurangi subduction interface, New Zealand, in the region of repeated Gisborne slow slip events, Geophys. J. Int., 180(1), 34–48. doi.org/10.1111/j.1365-246X.2009.04401.x
Saffer, D. M, L.M. Wallace, (2015), The frictional, hydrologic, metamorphic and thermal habitat of shallow slow earthquakes, Nat. Geosci., 8, 594–600. doi:10.1038/ngeo2490
Wallace, L.M., J. Beavan (2010), Diverse slow slip behavior at the Hikurangi subduction margin, New Zealand, J. Geophys. Res., 115, B12402. doi:10.1029/2010JB007717.

Reference information
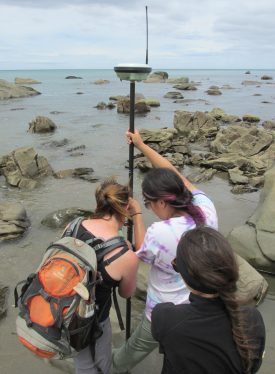
The NZ3D Experiment – Adding a new dimension for understanding slow slip events
GeoPRISMS Newsletter, Issue No. 40, Spring 2018. Retrieved from http://geoprisms.nineplanetsllc.com

Volatile cycling through the Hikurangi forearc, New Zealand


Jaime D. Barnes (UT Austin), Jeffrey Cullen (UT Austin), Shaun Barker (Univ. of Waikato), Samuele Agostini (Istituto di Geoscienze e Georisorse), Sarah Penniston-Dorland (Univ. of Maryland), John C. Lassiter (UT Austin), Andreas Klügel (Univ. of Bremen), Laura Wallace (UT Austin & GNS Science), Wolfgang Bach (Univ. of Bremen)

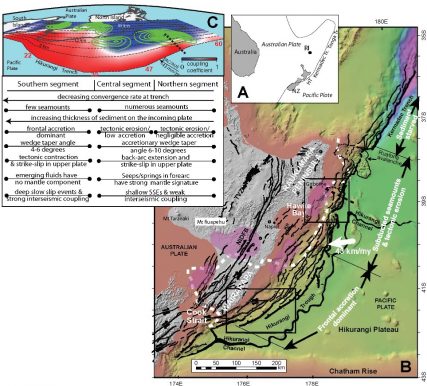
Much work has focused on defining the elemental concentration and isotopic composition of subduction zone inputs (e.g., sediments, altered oceanic crust, serpentinites), as well as outputs (e.g., volcanic gases and melt inclusions), in order to assess global cycling of volatiles. However, with most work focused on outputs from the volcanic front, poor constraints on the geochemistry of forearc outputs hamper global volatile flux calculations. In fact, most global flux calculations ignore contributions from the forearc because their outputs and the subducted sources contributing to the fore-arc outputs are poorly constrained (e.g., Barnes et al., 2018). The Hikurangi margin of New Zealand has a largely subaerial forearc which hosts numerous fore-arc seeps and springs (Fig. 1). This portion of the forearc is typically submerged beneath the ocean at most other subduction zones. Easy access to fore-arc springs along the margin allows for quantification of volatile flux and sources through the shallow portion of the subduction system (< 50 km).

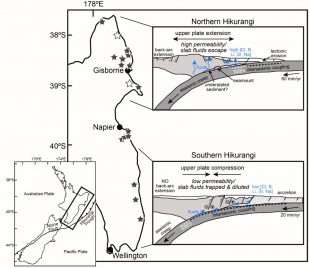
In addition, there are dramatic along strike variations in subduction parameters along the length of the Hikurangi margin (Fig. 1). The northern portion of the margin has a thin layer of sediments (~ 1 km thick) and many seamounts on the subducting plate, a steep taper angle (7º to 10º) for the accretionary wedge, and shallow (< 15 km depth) aseismic creep. In marked contrast, the southern portion of the margin has a thick (3 to 6 km thick) package of sediments on the incoming plate, low taper angle (4º to 6º), and undergoes stick-slip behavior (e.g., Wallace et al., 2009). Interestingly, previous studies have documented an overall decrease in the Cl, B, Br, Na, and Sr concentrations in fore-arc spring waters from the north to the south (Giggenbach et al., 1995; Reyes et al., 2010). These observations raise numerous questions, such as: the amount of slab-derived fluid component to the springs; whether fluid sources vary along the length of the margin; and particularly whether any chemical variations in the spring fluids record dehydration metamorphic reactions that may be linked to changes in slip behavior along the margin. In order to address these questions, we have sampled fluids from sixteen cold and two thermal springs from along the Hikurangi margin and analyzed them for their cation and anion concentrations, as well as their B, Li, and Cl stable isotope compositions. Because Li, Cl, and B are highly fluid-mobile elements, their incompatibility limits modification by fluid-rock interaction making them excellent tracers of fluid source.

Data show that Cl, Br, I, Sr, B, Li, and Na concentrations are high in the forearc springs, consistent with previous studies. Most of these elements show a general decrease in concentration from north to south, a high in the central part of the margin, and limited variability through time. Despite the dramatic change in concentration along the margin, there is no corresponding trend in isotopic composition. Cl and B isotope compositions are remarkably consistent along the margin, suggesting fluids dominated by seawater and sedimentary pore fluids. Lithium isotope compositions are highly variable, suggesting fluids sourced from seawater and locally modified by interaction with host rock. High Br/Cl and I/Cl weight ratios also support a dominant seawater and pore fluid source.

The decrease in the absolute volatile concentrations along the margin is therefore not due to changes in subduction parameters (e.g., convergence rate, sediment subduction) altering the fluid source along the strike. In addition, the shift in seismic behavior along the margin is not linked to a change in fluid source within the forearc region. Instead, we hypothesize that the shift in volatile concentrations along the margin is controlled by fluid flux through the upper plate, due to increasing upper plate permeability from south to north. In the northern portion of the margin, the upper plate is undergoing extension, whereas in the southern portion, the upper plate is undergoing transpression (Fig. 1) (Wallace et al., 2004). The extension in the northern section of the margin could increase the permeability of the upper plate allowing for fluid loss along normal faults, and possibly lower fluid pressure within the forearc and near the interface. In contrast, the transpressional regime in the south could decrease the permeability of the upper plate, trapping fluids and increasing fluid pressure in the upper plate (Fagereng and Ellis, 2009). This model of changing permeability from north to south explains the decrease in volatile concentrations in spring fluids along strike. In the south, trapping of expelled seawater and pore fluids in the upper plate will allow the fluids to become diluted by meteoric groundwater, but their isotopic compositions will remain unchanged. Whereas in the north, the seawater and pore fluids will be able to pass through the upper plate with less dilution by groundwater. Seismic tomographic and attenuation data also suggest that more fluids are present in the northern and central portions of the upper plate of the Hikurangi subduction zone, compared to the south (Eberhart-Phillips et al., 2017; Eberhart-Phillips et al., 2005; Eberhart-Phillips et al., 2008). Springs with the highest concentrations of volatile elements are located in regions with some of the highest seismic attenuation (which can be interpreted as abundant inter-connected fluids). It is possible that the fluid pressure conditions in the upper plate may play an important role in seismic behavior along the Hikurangi margin. Higher fluid pressures in the south suppress the transition from brittle to viscous deformation, resulting in a deeper brittle-viscous transition and the occurrence of stick-slip behavior to greater depths (Fagereng and Ellis, 2009; Wallace et al., 2012). Greater structural permeability in the northern Hikurangi margin may allow fluids to bleed off, without building significant overpressures in the forearc — this could lead to a comparatively shallower brittle to viscous transition. This work highlights the role of the upper plate tectonics and permeability in controlling the flow of fluid through the forearc and the geochemical consequences on shallow outputs through the subduction system. ■

References

Barnes, J.D., C.E. Manning, M. Scambelluri, J. Selverstone, (2018), Behavior of halogens during subduction zone processes, in Harlov, D., and Aranovich, L., eds., The Role of Halogens in Terrestrial and Extraterrestrial Geochemical Processes, Springer, 545-590.
Eberhart-Phillips, D., S. Bannister, M. Reyners, (2017), Deciphering the 3-D distribution of fluid along the shallow Hikurangi subduction zone using P-and S-wave attenuation. Geophys. J. Int., 211, 1054-1067.
Eberhart-Phillips, D., M. Reyners, M. Chadwick, J.M. Chiu, (2005), Crustal heterogeneity and subduction processes: 3-D Vp, Vp/Vs and Q in the southern North Island, New Zealand. Geophys. J. Int., 162, 270-288.
Eberhart-Phillips, D., M. Reyners, M. Chadwick, G. Stuart, (2008), Three-dimensional attenuation structure of the Hikurangi subduction zone in the central North Island, New Zealand. Geophys. J. Int., 174, 418-434.
Fagereng, A., S. Ellis, (2009), On factors controlling the depth of interseismic coupling on the Hikurangi subduction interface, New Zealand. Earth Planet. Sci. Lett., 278, 120-130.
Giggenbach, W. F., M.K. Stewart, Y. Sano, R.L. Goguel, G.L. Lyon, (1995), Isotopic and chemical composition of solutions and gases from the East Coast accretionary prism, New Zealand. Isotope and Geochemical Techniques Applied to Geothermal Investigations. IAEA-TECDOC, 788, 209–231.
Reyes, A.G., B.W. Christenson, K. Faure, (2010), Sources of solutes and heat in low-enthalpy mineral waters and their relation to tectonic setting, New Zealand. J. Volcanol. Geotherm. Res., 192, 117-141.
Wallace, L.M., J. Beavan, R. McCaffrey, D. Darby, (2004), Subduction zone coupling and tectonic block rotations in the North Island, New Zealand. J. Geophys. Res.: Solid Earth, 109(B12).
Wallace, L.M., A. Fagereng, S. Ellis, (2012), Upper plate tectonic stress state may influence interseismic coupling on subduction megathrusts. Geology, 40, 895-898.
Wallace, L.M., M. Reyners, U. Cochran, S. Bannister, P.M. Barnes, K. Berryman, G. Downes, D. Eberhart-Phillips, A. Fagereng, S. Ellis, A. Nicol, R. McCaffrey, R.J. Beavan, S. Henrys, R. Sutherland, D.H.N. Barker, N. Litchfield, J. Townend, R. Robinson, R. Bell, K. Wilson, W. Power, (2009), Characterizing the seismogenic zone of a major plate boundary subduction thrust: Hikurangi Margin, New Zealand. Geochem Geophys Geosyst, 10, Q10006, doi:10010.11029/12009GC002610.

Reference information
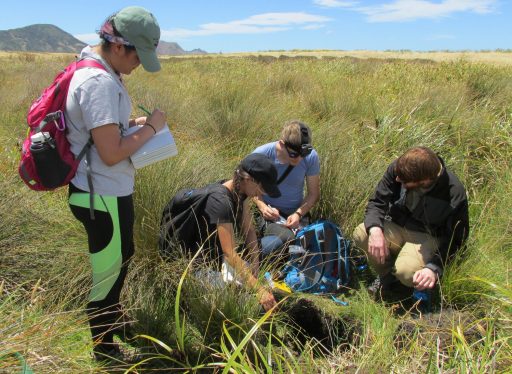
Volatile cycling through the Hikurangi forearc, New Zealand
GeoPRISMS Newsletter, Issue No. 40, Spring 2018. Retrieved from http://geoprisms.nineplanetsllc.com

Probing the nature of the Hikurangi margin hydrogeologic system


Evan A. Solomon (University of Washington), Marta Torres (Oregon State University), and Robert Harris (Oregon State University)

Fluid generation, migration, and pore fluid pressure at subduction zones are hypothesized to exert a primary control on the generation of seismicity, low-frequency earthquakes, and slow slip events (SSEs) (e.g. Ranero et al., 2008; Obana and Kodaira, 2009; Saffer and Tobin, 2011; Saffer and Wallace, 2015). The SAFFRONZ (Slow-slip and fluid flow response offshore New Zealand) project addresses the GeoPRISMS Subduction Cycles and Deformation Initiative Science Plan by testing interrelationships among fluid production, fluid flow, and slow slip at the Hikurangi Margin. The recognition of dramatic changes in the along-strike distributions of SSEs and their recurrence intervals, interseismic coupling, inferred pore pressure, and other subduction-related parameters (Fig. 1) have resulted in a concerted international effort to acquire seismological, geodetic, other geophysical, and geomechanical data both onshore and offshore the Hikurangi margin. This effort includes recent scientific ocean drilling, logging, and the deployment of two subseafloor observatories during IODP Expeditions 372 and 375 (see page 16 of this issue), as well as a 3-D seismic reflection survey on the northern margin. (p. 14).

SAFFRONZ will complement and extend these efforts by providing:

A continuous two-year record of fluid flow rates and composition over the timeframe of the next expected SSE,

Information on the present background state and past locations of fluid flow and how they relate to inferred pore fluid overpressure along the plate boundary, and

Comparative geochemical and hydrologic data between the northern and southern sections of the margin.

The SAFFRONZ field program is scheduled for January 10 to February 14, 2019 on the R/V Revelle. Our field strategy employs a nested approach to constrain the margin-wide fluid flow distribution tied to estimated pore pressure evolution along the plate boundary from modeling studies and seismic attributes.

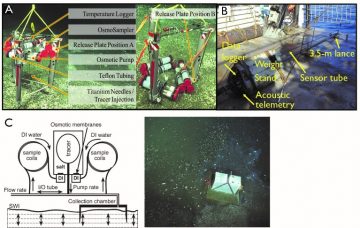
We are specifically targeting fault zones and off-fault locations between the deformation front and the shelf-break (Fig. 2). Site locations will be guided by pre-existing multi- and single-beam sonar data (including seafloor backscatter and water column indicators of gas seepage), 2D/3D seismic reflection data, and real-time water column multi-beam sonar surveys during the research expedition. Violin-bow heat flow measurements and piston coring will guide ROV Jason hydroacoustic surveys, Jason heat flow probe measurements, and the collection of push cores to further identify sites of active fluid discharge. Finally, the ROV surveys will guide the deployment of benthic fluid flow meters (Fig. 3) to generate a record of fluid flow rates and composition over a two-year period – the approximate recurrence interval for SSEs in this region. We anticipate deploying about sixteen benthic fluid flow meters, some co-located with seafloor bottom pressure recorders managed by GNS Science, during the 2019 field program.Although our focus is on the northern margin, the location of shallow SSEs and most research activity, we will also conduct ship and ROV operations and deploy a subset of fluid flow meters in the southern region of the margin.

Comparison of fluid flow pathways, fluid composition, fluid flow rates, and flow transients between the northern and southern areas will provide information on the differences in the nature of dewatering between the accretionary southern portion of the margin hosting deep SSEs and the dominantly non-accretionary northern portion with shallow SSEs. The along-strike comparison will also provide a control (reference) transect to compare regional (i.e. flow in response to SSEs in the north) to other hydrologic phenomena.

From both scientific and societal perspectives, results from this project will contribute to our understanding of fault slip behavior offshore New Zealand that have global implications for the postulated interdependence of temperature, pore pressure, fluid flow, and SSEs at subduction zones. The ability to integrate the SAFFRONZ experiment with concurrent bottom pressure recorder deployments, onshore cGPS data, IODP borehole monitoring experiments, 2D and 3D seismic reflection data, and other data to be collected along the margin in the next few years greatly enhance the outcomes of this project. The synthesis of the results from all the concurrent experiments being conducted at Hikurangi promises to be very exciting and the integration of the hydrologic data produced from this project will result in an unprecedented view of deformation and hydrological responses to slow slip at subduction zones. ■

References

Barnes, P.M., G. Lamarche, J. Bialas, I. Pecher, S. Henrys, G. Netzeband, J. Greinert, J. Mountjoy, K. Pedley, G. Crutchley, (2010), Tectonic and Geological framework for gas hydrates and cold seeps on the Hikurangi subduction margin, New Zealand, Marine Geology. doi: 10.1016/j.margeo.2009.03.012
Brown, K.M., M.D. Tryon, H.R. DeShon, L.M. Dorman, S.Y. Schwartz (2005), Correlated transient fluid pulsing and seismic tremor in the Costa Rica subduction zone, Earth Planet. Sci. Lett., 238, 189-203.
Obana, K., S. Kodaira,(2009), Low-frequency tremors associated with reverse faults in a shallow accretionary prism. Earth Planet. Sci. Lett. 287, 168–174.
Ranero, C. R., I. Grevemeyer, H. Sahling, U. Barckhausen, C. Hensen, K. Wallmann, W. Weinrebe, P. Vannucchi, R. von Huene, K. McIntosh (2008), Hydrogeological system of erosional convergent margins and its influence on tectonics and interplate seismogenesis, Geochemistry Geophysics Geosystems, 9(3), Q03S04.
Saffer, D.M., H.J. Tobin, (2011), Hydrogeology and mechanics of subduction zone forearcs: Fluid flow and pore pressure, Ann. Rev. Earth Planet. Sci., 39, 157-186.
Saffer, D.M., L.M. Wallace, (2015), The frictional, hydrologic, metamorphic and thermal habitat of shallow slow earthquakes. Nat. Geosci., 8(8), 594–600.
Saffer, D.M., L.M. Wallace, K. Petronotis, (2017), Expedition 375 Scientific Prospectus: Hikurangi margin coring and observatories. International Ocean Discovery Program. doi.org/10.14379/iodp.sp.375.2017
Solomon, E.A., M. Kastner, H. Jannasch, G. Robertson, Y. Weinstein, (2008), Dynamic fluid flow and chemical fluxes associated with a seafloor gas hydrate deposit on the northern Gulf of Mexico slope. Earth Planet. Sci. Lett. 270, 95-105.
Tryon, M.D., K.M. Brown, M.E. Torres, (2002), Fluid and chemical flux in and out of sediments hosting methane hydrate deposits on Hydrate Ridge, Or, II: hydrological processes. Earth Planet. Sci. Let. 201, 541–557.
Wallace, L.M., J. Beavan, R. McCaffrey, D. Darby, (2004), Subduction zone coupling and tectonic block rotation in the North Island, New Zealand, J. Geophys. Res., 109, doi:10.1029/2004JB003241
Wallace, L.M., J. Beavan, (2010), Diverse slow slip behavior at the Hikurangi subduction margin, New Zealand, J. Geophys Res., 115(B12402), doi:10.1029/2010JB007717.

Reference information
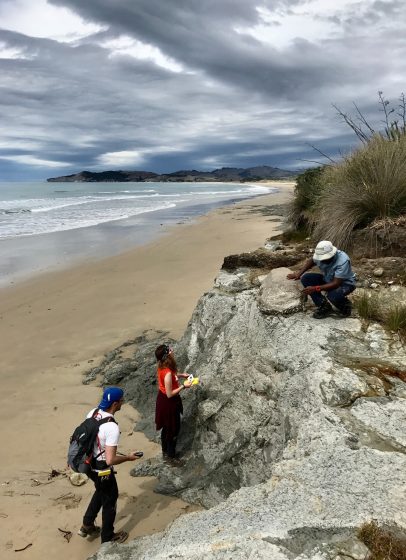
Probing the nature of the Hikurangi margin hydrogeologic system
GeoPRISMS Newsletter, Issue No. 40, Spring 2018. Retrieved from http://geoprisms.nineplanetsllc.com

Slow slip and future earthquake potential in New Zealand and Cascadia


Noel Bartlow (University of Missouri), Laura Wallace (UT Austin & GNS Science), Ryan Yohler (University of Missouri), and Charles Williams (GNS Science)

The New Zealand and Cascadia subduction zones are two GeoPRISMS primary sites that have captured the interest of geophysicists from around the world. Both subduction zones feature significant geological hazards, including the potential for large earthquake ruptures and tsunamis. In New Zealand, the capital city of Wellington sits directly atop a large patch of the main subduction plate interface which is frictionally locked, with the potential to rupture in future earthquakes. In Cascadia, there is also potential for a large earthquake on the main subduction interface, which may impact cities such as Portland, OR and Seattle, WA.

Both New Zealand and Cascadia also host slow slip events (SSEs). Slow slip events consist of slip on the subduction plate interface – just as would occur in an earthquake – except the slip takes place more slowly than it would during an earthquake. Now that slow slip events are widely recognized at many subduction zones, it is critical to better understand their role in the accommodation of plate motion. Many questions also exist regarding implications of slow slip for subduction zone mechanics, and the relationship between slow slip events and seismic slip events on the plate boundary.

In New Zealand, slow slip events have been shown to trigger regular earthquakes up to magnitude 6 (e.g. Wallace et al., 2017). Additionally, some evidence exists from the 2011 Tohoku-Oki Mw 9.0 earthquake (e.g. Ito et al., 2013) and the 2014 Mw 8.1 Iquique earthquake (Ruiz et al., 2014) that slow slip events may be able to trigger damaging megathrust events. Most slow slip events do not trigger earthquakes and we currently cannot differentiate slow slip events that might trigger large earthquakes from those that will not. It is possible, however, that further study will lead to methods that allow slow slip events to be used as reliable earthquake precursors.

PIs Noel Bartlow (Univ. of Missouri) and Laura Wallace (UTIG), along with collaborator Charles Williams (GNS Science New Zealand) and graduate student Ryan Yohler (Univ. of Missouri) are studying slow slip events and frictional locking in New Zealand and Cascadia.

One goal of the project is to create self-consistent catalogs of slow slip events in both subduction zones that capture the time varying behavior of slow slip, including how these events grow and decay and move along the subduction plate interface. The data used for these models consists of land-based geodetic GPS time series, and in New Zealand, we also use vertical deformation of the seafloor recorded for one slow slip event using absolute pressure sensors (Wallace et al., 2016).

Previous time varying slow slip event modeling studies usually assume a uniform, elastic half-space (e.g. Bartlow et al., 2014). These new models utilize spatially-varying elastic properties within the earth based on seismic velocity models in both New Zealand and Cascadia, calculated using the PyLith finite element code. This leads to more accurate models of slip during slow slip events, and therefore, more accurate estimates of the amount of slip taken up in slow slip as opposed to being available for release in future earthquakes. Preliminary models for both New Zealand (Williams et al., 2017) and Cascadia (Bartlow et al., 2017) were shown at the American Geophysical Union 2017 Fall meeting. Additionally, a time-dependent model incorporating both onshore GPS and offshore pressure measurements for the 2014 Gisborne, New Zealand slow slip events was shown at the meeting by graduate student Ryan Yohler (Yohler et al., 2017). This model is shown in Figure 1. This slow slip event occurred near the locations of two historical 1947 earthquakes that caused damaging tsunami waves. This is the first time that seafloor geodetic data have been used in a time-dependent deformation model.

As part of this project, a team led by Laura Wallace, including Bartlow and other collaborators, have recently reported the occurrence of a large, shallow (<15 km), two-week slow slip event at the Northern Hikurangi margin triggered dynamically by passing seismic waves from the November 2016 magnitude 7.8 Kaikōura earthquake, over 600 km away (Fig. 2; Wallace et al., 2017). Long-duration (>1 year), deep (>25 km) slow slip was also triggered at the southern Hikurangi margin (Kapiti region), and afterslip occurred on the subduction interface beneath the northern South Island of New Zealand (Fig. 1).

Triggered slow slip at southern Hikurangi is more likely due to large static stress changes induced by the Kaikōura earthquake, given that area’s closer proximity to the earthquake (Wallace et al., 2018). Prior studies had already identified cases of slow slip events triggering earthquakes, and nearby earthquakes prematurely stopping ongoing slow slip events, but these studies are the first to show that dynamic and/or static stress changes from passing seismic waves may also trigger large-scale, widespread slow slip events. We are still discovering the wealth of possible complex interactions between slow slip events and earthquakes, and what they might mean for hazards. ■

References

Bartlow, N.M., C.A. Williams, L.M. Wallace, (2017), Building a catalog of time-dependent inversions for Cascadia ETS events. In AGU Fall Meeting Abstracts.
Bartlow, N.M., L.M. Wallace, R.J. Beavan, S. Bannister, P. Segall, (2014), Time‐dependent modeling of slow slip events and associated seismicity and tremor at the Hikurangi subduction zone, New Zealand. J. Geophys. Res.: Solid Earth, 119(1), 734-753.
Ito, Y., R. Hino, M. Kido, H. Fujimoto, Y. Osada, D. Inazu, Y. Ohta, T. Linuma, M. Ohzono, S. Miura, M. Mishina, (2013), Episodic slow slip events in the Japan subduction zone before the 2011 Tohoku-Oki earthquake. Tectonophysics, 600, 14-26.
Ruiz, S., M. Metois, A. Fuenzalida, J. Ruiz, F. Leyton, R. Grandin, C. Vigny, R. Madariaga, J. Campos, (2014), Intense foreshocks and a slow slip event preceded the 2014 Iquique Mw 8.1 earthquake. Science, 345(6201), 1165-1169.
Wallace, L.M., S. Hreinsdottir, S. Ellis, I. Hamling, E. D’Anastasio, P. Denys, (2018), Triggered slow slip and afterslip on the southern Hikurangi subduction zone following the Kaikōura earthquake. Geophys. Res. Lett., 45, doi.org/10.1002/2018GL077385
Wallace, L.M., Y. Kaneko, S. Hreinsdóttir, I. Hamling, Z. Peng, N.M. Bartlow, E. D’Anastasio, B. Fry, (2017), Large-scale dynamic triggering of shallow slow slip enhanced by overlying sedimentary wedge. Nat. Geosci., 10(10), 765.
Wallace, L.M., S.C. Webb, Y. Ito, K. Mochizuki, R. Hino, S. Henrys, S. Schwartz, S., A.F. Sheehan, (2016), Slow slip near the trench at the Hikurangi subduction zone, New Zealand. Science, 352(6286), 701-704.
Williams, C.A., L.M. Wallace, N.M. Bartlow, (2017), Time-dependent inversions of slow slip at the Hikurangi subduction zone, New Zealand, using numerical Green’s functions. In AGU Fall Meeting Abstracts.
Yohler, R.M., N.M. Bartlow, L.M. Wallace, C.A. Williams, (2017), Constraining slip distributions and onset of shallow slow slip in New Zealand by joint inversions of onshore and offshore geodetic data. In AGU Fall Meeting Abstracts.

Reference information
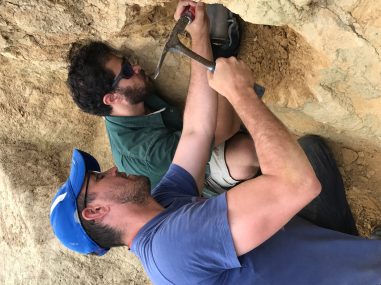
Slow slip and future earthquake potential in New Zealand and Cascadia
GeoPRISMS Newsletter, Issue No. 40, Spring 2018. Retrieved from http://geoprisms.nineplanetsllc.com