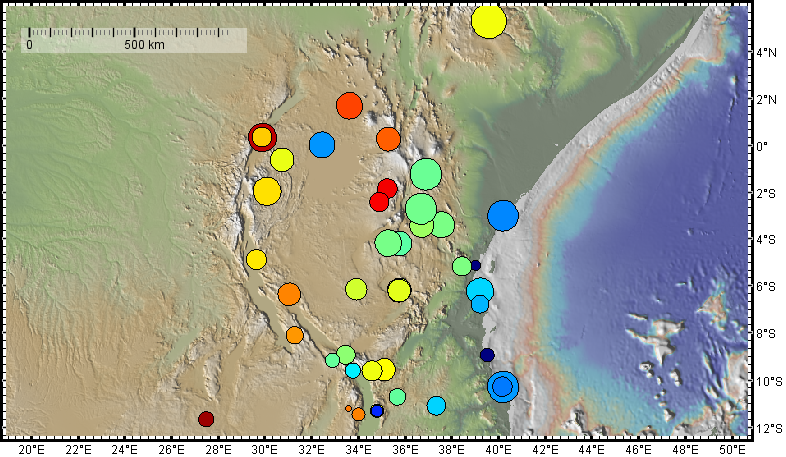
Figure 1. The King et al. EARS 2016.0a velocity field in a no-net-rotation frame with station symbols coloured on the North component of velocity and scaled on East velocity. Warm colors are faster velocities. The built-in background elevation map is the 30m-resolution ASTER land topography. Image made with GeoMapApp. All of the data sets shown are accessible through the GeoMapApp menus.
Geodynamic Processes at Rifting and Subducting Margins

