Late Stage Rifting and Early Seafloor Spreading History of the Eastern North American Margin


Anne Bécel
Lamont-Doherty Earth Observatory, Columbia University

During September-October 2014, the NSF-GeoPRISMS-funded Eastern North American Margin (ENAM) Community Seismic Experiment (CSE) collected deep penetration multichannel seismic (MCS) reflection profiles covering a 500 km wide section of the Mid-Atlantic passive margin offshore North Carolina, which formed after the Mesozoic breakup of supercontinent Pangea The ENAM-CSE data extend farther offshore than previous seismic surveys conducted in this area and encompass the full transition from continental breakup to mature seafloor spreading while specifically providing unique constraints on the events surrounding the final stage of continental rifting and the initial stage of seafloor spreading, which remain poorly understood. The results shown here demonstrate the ability of MCS data to image four distinct domains that highlight different basement characteristics and provide new insights on the degree of extensional strain localization experienced during continental breakup and how the earliest oceanic crust was formed after rifting.

Introduction

The Eastern North American Margin (ENAM) is a passive continental margin that was formed by the rifting of the Pangaea supercontinent and the opening of the Atlantic Ocean during the Late Triassic and Early Jurassic.

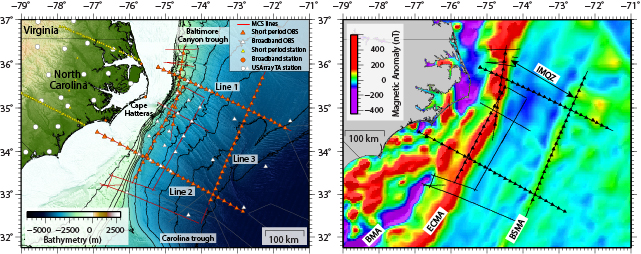
Figure 1. a) Elevation Map (Andrews et al., 2016) contoured every 500 m showing the location of the ENAM Community Seismic Experiment. Line 1 and ENAM Line 2 were chosen to characterize the deep structure of the Carolina Trough south of Cape Hatteras, and the Baltimore Canyon Trough north of Cape Hatteras, respectively whereas the Line 3 was chosen to characterize the structure of the crust and uppermost mantle to better understand the origin of the Blake Spur Magnetic anomaly. b) Magnetic anomaly map (Maus et al., 2009) of the North American Margin. ECMA: East Coast Magnetic Anomaly; BSMA: Blake Spur Magnetic Anomaly; IMQZ: Inner Magnetic Quiet Zone.

From offshore Nova Scotia to Florida, the ENAM has been classified as a volcanic-type margin (Marzoli et al. 1999). Multichannel seismic profiles have imaged seaward dipping reflectors (SDRs) that have been attributed to the subaerial eruption and subsequent subsidence of volcanic flows emplaced during the final phase of rifting (Austin et al., 1990). Seismic refraction profiles beneath the volcanic wedges have revealed a thick sequence of high seismic velocity lower crust rocks interpreted as igneous/magmatic underplating (Holbrook et al., 1994). The East Coast magnetic anomaly (ECMA) is a high-amplitude positive magnetic anomaly running along the length of the margin (Fig. 1) (Keller et al., 1954). The source of the ECMA has been primarily attributed to seaward dipping reflectors in the upper crust (Austin et al., 1990) and is interpreted as the limit between the continental crust and the normal oceanic crust. However, the exact nature and the width of the zone between the continental crust and normal oceanic crust remain uncertain. This zone is thought to either represent a new anomalously thick magmatic crust with higher velocity than lower oceanic crust with no continental crust present (Talwani et al., 1995) or a zone with volcanics on top of magmatic material intruded into extended continental crust or underplated beneath. The nature and the width of this zone are of fundamental importance to understanding the late stage rifting processes and over what time period the continental breakup occurred at this volcanic margin. Margins that experience a voluminous magmatism during rifting tend to have a more rapid continental breakup with a smaller zone of crustal extension (i.e. strain localization) and tend to develop more symmetric conjugate margins.

The Blake Spur magnetic anomaly (BSMA) is a positive, linear magnetic anomaly located 150-250 km to the east of the ECMA (Fig. 1). The BSMA is of lower amplitude than the ECMA but also consists of segments with several magnetic peaks separated by troughs. The age of BSMA is unknown but extrapolated ages range between 168-173 Ma. The nature and origin of this magnetic anomaly is still debated and different models have been proposed. BSMA is either thought to mark a ridge jump (Vogt, 1973), magmatic pulse associated to a plate re-organization (Klitgord and Schouten, 1986; Kneller et al., 2012) or a change in spreading rate/direction and asymmetry of incipient seafloor spreading during the early opening of the Central Atlantic (Labails et al., 2010). In the ridge jump scenario, the BSMA is thought to represent a sliver of West African rifted continental crust that experienced continental breakup magmatism and that was left on the Eastern North American margin after the early spreading center jumped east of the BSMA. This model implies that a now extinct mid-ocean ridge lies between ECMA and BSMA.

The Inner Magnetic (Jurassic) Quiet zone (IMQZ) lies between the ECMA and the BSMA (Bird et al., 2007). Because the magnetic anomalies are of very low amplitudes and variable in shape, the correlation of magnetic anomalies with magnetic reversals remains challenging in this zone (Fig. 1). Timing and location of breakup at the ENAM thus remain uncertain and the spreading rate of the earliest normal oceanic crust in the IMJQ is not well constrained.

Data acquisition and project goals

This project aims to extract information on the late-stage continental rifting including the relationship between the timing of rifting and the occurrence of offshore magmatism and early seafloor history of the Central Atlantic using multichannel (MCS) data from the ENAM-CSE. The MCS data were acquired on R/V Marcus Langseth using a 6600 cu. in. tuned airgun array and 636 channel 8-km-long streamer. The source and the streamer were both towed at a depth of 9 m for deep imaging. This project involves the multichannel seismic processing and interpretation of two offshore margin normal profiles (450-km-long and 370-km-long, respectively), spanning from continental crust ~50 km off the coast to mature oceanic crust 110 km east of the BSMA and a ~350-km-long MCS profile along the BSMA (Fig. 1). These primary MCS lines are also coincident with the ENAM seismic refraction profiles recorded on ocean bottom seismometers.

Results

The high-resolution MCS data provide detailed structure of the sedimentary cover and crust (Fig. 2 and Fig. 3). The initial images of the two margin normal profiles reveal several major changes in the basement character and roughness between the ECMA and the BSMA (Fig. 2) that have not been previously described. The four domains described below correspond to distinct magnetic anomalies that suggest that magnetization contrasts exist between those domains. The interpretation of the new observations from MCS data give new important insights into the late stage of rifting and rift to drift transition.

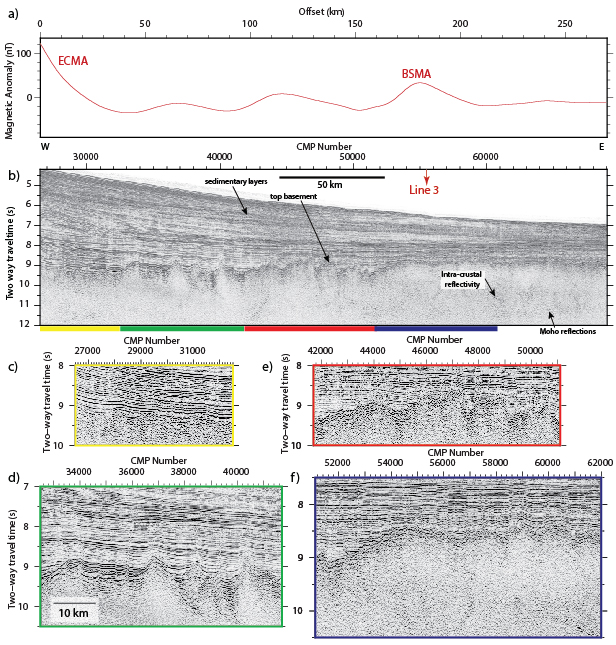
Figure 2. a) Magnetic anomaly profile coincident to the seaward part of ENAM-MCS Line 2 (Maus et al., 2009). b) Post-stack time migrated profile of the seaward part of ENAM-MCS Line 2 c) d) e) f) zooms into the four different domains discussed in the text and that display different basement characteristics.

From CDP 26500 to CDP 32500 (Fig. 2a and 2c), the top of the basement is smooth and less reflective than on the seaward part of the profile and it is also less distinguishable from the sedimentary layers above. The top basement characteristics suggest that it could correspond to smooth volcanic flows emplaced in shallow water conditions and coincide with the landward onset of the ECMA.

From CDP 32500 to CDP 41700 (Fig. 2a and 2d), there is a step up in the basement and a drastic change in the basement roughness. In this area, the crust is highly tectonized by normal faulting forming tilted, faulted crustal blocks. This crust could be interpreted as highly extended continental crust due to the geometry of syn-rift sedimentary sequences in the basement half-grabens. This interpretation would be in conflict with the zone between the continent and the oceanic being purely magmatic and would suggest that continental crust could have been thinned by faulting before being intruded by igneous material. Alternatively, this crust could be oceanic crust formed at very slow spreading rates (<15 mm/yr). Very slow-spreading crust is known to be fragmented by normal faulting with large crustal blocks (long wavelengths). On the sole basis of basement architecture, we cannot fully support either of the two proposed hypotheses. Ocean-bottom seismometer (OBS) refraction data acquired during the ENAM-CSE and coincident with the MCS data used in this project will help to decipher the nature of the crust where tilted basement blocks are imaged.

From CDP 41700 to CDP 51100 (Fig. 2a and 2e), the basement roughness appears to be that of a typical oceanic crust formed at a steady state slow spreading ridge.
From CDP 51100 to CDP 62000 (Fig. 2a and 2e), starting at the BSMA anomaly and seaward, the top basement is very smooth and reflective and the BSMA anomaly appears to coincide with a step-up in top basement.

Along the BSMA, clear Moho (Mohorovic Discontinuity) reflections are observed 2.5-3 s (8.12-9.75 km assuming an average crustal velocity of 6.5 km/s) beneath the top basement (Fig. 3) and are relatively continuous. Abundant intracrustal reflections, primarily restricted within the oceanic lower crust, are also observed over crust formed at BSMA time but also in younger crust.
In the ridge jump scenario, the BSMA would represent thinned continental crust intruded by igneous material. However, the top basement is very reflective indicating a strong impedance contrast between the sediment layers and the top basement. This would be more in agreement with a top basement produced by submarine seafloor spreading at a mid-ocean ridge than subaerial or shallow water emplacement of volcanics within sediments that would reduce the impedance contrast as in Fig. 2c.

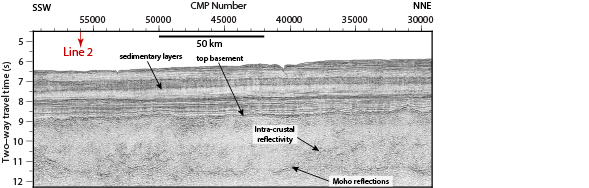
Figure 3. Part of pre-stack time migrated profile (ENAM-MCS Line 3) along the Blake Spur Magnetic Anomaly.

The layering imaged within the lower crust (Fig. 2f) could indicate magmatic intrusives but the well-developed Moho would suggest no underplating. In addition, lower crustal reflections persist in younger crust beyond the BSMA suggesting that this crust is not continental crust that experienced pervasive melt migration during extension. There is also no evidence of a fossil spreading center between ECMA and BSMA.

A drastic increase in seafloor spreading rate and a change in the spreading in the vicinity of the BSMA could explain the change of the basement smoothness from rough to smooth and the basement relief but would not explain the thicker than normal oceanic crust. A magmatic pulse at BSMA time would produce a strongly magnetized upper oceanic crust and could explain the magnetic anomaly. The magnetic pulse would also be in agreement with the thicker than normal oceanic crust and smooth basement topography observed in the data.

The outcomes of the project described above clearly show that the MCS data from the ENAM-CSE provide important information for the study of late-stage rifting processes at this margin. Ultimately, results will be integrated with the landward part of the profiles (not shown here).

This project involves collaboration with Brandon Shuck and Harm van Avendonk at UTIG who are working on the offshore wide-angle reflection/refraction modeling coincident to the multichannel seismic lines used in this project. By combining constraints from the multichannel seismic profiles, refraction modeling and potential field studies, we hope to better understand implications for variations in crustal structures, faulting and magmatism seen in the MCS data at this margin and at a broader scale expand our knowledge of the continental breakup and early seafloor spreading at passive margins worldwide. Results from this project will also be integrated with two others GeoPRISMS projects recently awarded that aim to examine other datasets from the ENAM-CSE. ■

References

Andrews, B.D., J.D. Chaytor, U.S. ten Brink, D.S. Brothers, J.V. Gardner, E.A Lobecker, and B.R.Calder, (2016), Bathymetric terrain model of the Atlantic margin for marine geological investigations (ver. 2.0, May 2016): U.S. Geological Survey Open-File Report 2012–1266, 12 p., 1 pl.
Austin, J. A., P. L. Stoffa, J. D. Phillips, J. Oh, D. S. Sawyer, G. M. Purdy, E. Reiter, and J. Makris (1990), Crustal structure of the Southeast Georgia embayment-Carolina Trough: Preliminary results of a composite seismic image of a continental suture (?) and a volcanic passive margin, Geology, 18(10), 1023-1027.
Bird, D. E., S. A. Hall, K. Burke, J. F. Casey, and D. S. Sawyer (2007), Early Central Atlantic Ocean seafloor spreading history, Geosphere, 3, 282-298.
Holbrook, W. S., G. M. Purdy, R. E. Sheridan, L. Glover, M. Talwani, J. Ewing, and D. Hutchinson (1994), Seismic structure of the US Mid‐Atlantic continental margin, J. Geophys. Res., 99(B9), 17871-17891.
Keller Jr. F., J. L. Meuschke, and L. R. Alldredge (1954), Aeromagnetic surveys in the Aleutian, Marshall, and Bermuda Islands, Trans. Am. Geophys. Union, 35(4), 558-572.
Klitgord, K. D., and H. Schouten (1986), Plate kinematics of the central Atlantic, in The geology of North America, vol. M, The Western North Atlantic Region, edited by P. R. Vogt and B. E. Tucholke, 351-378, Geological Society of America, Boulder, Colorado.
Kneller, E. A., C. A. Johnson, G. D. Karner, J. Einhorn, and T. A. Queffelec (2012), Computers & Geosciences Inverse methods for modeling non-rigid plate kinematics : Application to mesozoic plate reconstructions of the Central Atlantic, Comput. Geosci., 49, 217–230, doi:10.1016/j.cageo.2012.06.019.
Labails, C., J. L. Olivet, D. Aslanian, and W. R. Roest (2010), An alternative early opening scenario for the Central Atlantic Ocean, Earth Planet. Sci. Lett., 297(3-4), 355-368.
Marzoli, A., P. R. Renne, E. M. Piccirillo, M. Ernesto, G. Bellieni, and A. De Min (1999), Extensive 200-million-year-old continental flood basalts of the Central Atlantic Magmatic Province, Science, 284, 616–618, doi:10.1126/science.284.5414.616.
Maus, S., U. Barckhausen, H. Berkenbosch, N. Bournas, J. Brozena, V. Childers, F. Dostaler, J. D. Fairhead, C. Finn, R. R. B. von Frese, C. Gaina, S. Golynsky, R. Kucks, H. Lühr, P. Milligan, S. Mogren, R. D. Müller, O. Olesen, M. Pilkington, R. Saltus, B. Schreckenberger, E. Thébault, and F. Caratori Tontini (2009), EMAG2: A 2-arc min resolution Earth Magnetic Anomaly Grid compiled from satellite, airborne, and marine magnetic measurements, Geochem. Geophys. Geosyst., 10, 1-12, doi:10.1029/2009GC002471.
Talwani, M., J. Ewing, R. E. Sheridan, W. S. Holbrook, and L. Glover III (1995), The EDGE experiment and the US East Coast magnetic anomaly, in rifted ocean-continent boundaries, edited by E. Banda, M. Torné and M. Talwani, 155-181, Kluwer Academic Publishers, Dordrecht, The Netherlands.
Vogt, P.R. (1973), Early events in the opening of the North Atlantic. in Implications of continental rift to the Earth Sciences, edited by D. H. Taling and S. K. Runcorn, Academic Press, New York, 693-712.

Reference information
Late Stage Rifting and Early Seafloor Spreading History of the Eastern North American Margin. A. Bécel
GeoPRISMS Newsletter, Issue No. 38, Spring 2017. Retrieved from http://geoprisms.nineplanetsllc.com

Report: The Subduction Zone Observatory Workshop


Jeff McGuire1, Terry Plank2
1Woods Hole Oceanographic Institution, 2Lamont-Doherty Earth Observatory, Columbia University

On September 29-October 1 2016 an International Workshop was held in Boise Idaho to discuss what a Subduction Zone Observatory initiative could accomplish and what form it might take. The workshop was proposed by the IRIS, UNAVCO, Earthscope, and GeoPRISMS offices in response to the high level of community interest over the past years. The SZO workshop was sponsored primarily by the U.S. NSF, with support coming from eight different programs within the GEO division as well as the Office of International Science and Engineering. Additionally, the USGS supported over twenty of its scientists to attend and the Earth Observatory of Singapore supported the attendance of over fifteen scientists from a number of countries in Southeast Asia. By design, the meeting was exceptionally diverse: of the 242 scientists in attendence, 67 were early career investigators and graduate students and 45 were from 21 different countries outside the U.S.
The workshop was organized around four themes:

  • Deformation and the Earthquake Cycle;
  • Volatiles, Magmatic processes and Volcanoes;
  • Surface Processes and the Feedbacks between Subduction and Climate; and
  • Plate Boundary Evolution and Dynamics.

Thirty-two breakout sessions over the course of the meeting gave attendees abundant opportunity to weigh in on the most important scientific opportunities, the key obstacles holding back discoveries, and the types of future community scale efforts that would best advance subduction zone science. Participants were asked “What is new, exciting, and doable?” and “What can’t we do now?”. Additionally, over sixty whitepapers were submitted with ideas about what an SZO might look like and four webinars were conducted that discussed opportunities afforded at different locations around the world. The presentations, break out reports, white papers, and webinars are all available for viewing on the workshop website.

Much of the scientific enthusiasm at the workshop resulted from recent examples of spectacular new types of datasets that provide a window towards a next generation approach to understanding Subduction Zones. Many phenomena that were previously captured as static snapshots are now starting to be shown as movies, in 4D. From the locking of the plate boundary fault, to the gases expelled from volcanoes prior to eruption, to the surface mass transport between forearc mountains and the trench, to geological records of past ruptures spanning back thousands of years, newly available observational time series are revealing dynamically evolving processes.

The key to understanding both the basic science and the societal hazard requires recording this 4D evolution and being able to quantitatively model it. Synergistically, the sensors deployed for basic research are finding evermore practical applications. Earthquake and tsunami early warning, volcanic ash observatories and dispersion models linked with global air traffic control, eruption warnings based on volcanic unrest, incipient landslides detected by satellites, all rely on sensor suites that now serve the dual purpose of a greater scientific understanding and a reduction in societal hazards. The technology for studying subduction zones is exploding in many ways but this has not yet been translated to the necessary scales to accelerate discovery and improve warning systems.

Examples of timeseries data prior to earthquakes and eruptions. 8.1 Tarapaca earthquake (from Brodsky and Lay, Science, 2014) and 2014 eruption of Turrialba volcano (from deMoor et al., JGR, 2016). Timeseries show notable events in the weeks preceeding the mainshock (1 April 8.1) and eruption (pink bar), in the form of migrating swarms of foreshocks and a rise in the CO2/S ratio of gas, respectively. Such events are rarely captured, but generated excitement at the SZO Workshop as emergent phenomena that require a coordinated, multidisciplinary effort.

USGS scientists presented an overview of their plans for new research directions aimed at reducing geohazards from subduction zone eruptions, earthquakes, tsunamis, and landslides. There was considerable debate during the workshop about the relationship between basic science in subduction zones and mission-oriented science aimed at hazard reduction. An SZO initiative will undoubtedly have an impact on both and must carefully articulate its synergistic efforts with the USGS, NASA, and NOAA. In practice, there is considerable overlap between these two goals and many of the same fundamental questions and observational datasets are key to each. Moreover, it was recognized that hazard reduction will be the single most important driver of many of our international collaborators who will be critically important in making SZO a global scale initiative. Hazards will also form the key focus of many education and outreach efforts that could produce a significant impact if approached at the community scale. Overall, the workshop supported a primary driving goal of any SZO initiative to be the development of a deeper understanding of the physical and chemical processes that underlie subduction zone hazards.

The Cascadia and Alaska subduction zones lie within U.S. borders and present a pressing array of unsolved problems and opportunities in subduction zone science. Key hazards to U.S. populations drive the basic science community and the mission agencies to collaborate. However, the workshop participants also emphasized the need to go global to really understand subduction zone processes. Many regions present unique opportunities, such as the ability to drill the seismogenic zone, extremely active volcanic arcs, seismic gaps with centuries of strain accumulation, and likely tsunami earthquakes, that provide a natural potential to capture key phenomena. Moreover, many subduction processes have natural cycles on the scale of decades or centuries and the only way we will piece together a complete understanding of the whole cycle is to piece together what we can learn from different regions that are currently at different stages of that cycle.

Workshop participants recognized that a variety of programatic approaches will advance subduction zone science, that many styles have been successful in the past, and different aspects could be phased in over time. Three key components were identified:

  • A Community Modeling Collaboratory,
  • An Interdisciplinary Science Program, and
  • A Large Scale Infrastructure Program.

This combination over a 10-year effort could reveal new phenomena, integrate data with models, and lead to hazard forecasting that is informed by fundamental tectonic, physical, and chemical drivers. A diverse committee of scientists is currently writing up a detailed report on the priorities and strategies identified during the meeting. The report is on target to be put up for comment in late 2016 and finalized in early 2017. ■

Reference information
The Subduction Zone Observatory Workshop . J. McGuire, T. Plank

GeoPRISMS Newsletter, Issue No. 37, Fall 2016. Retrieved from http://geoprisms.nineplanetsllc.com

Spotlight | Investigating mantle controls on volcano spacing along the East African Rift System


Eric Mittelstaedt & Aurore Sibrant

University of Idaho

Figure 1. Digital Elevation model of the eastern part of Africa showing the main part of the East African Rift System (EARS). Solid black lines show major faults bounding rift depressions. The white dashed square shows the location of the focus rift and the black dashed elliptical lines indicates Ethiopian and Kenya domes. The thick black lines indicate the boundaries of the Congo and Tanzanian Craton.

The spatial variation in magma supply within a continental rift may determine the mode of lithospheric extension (active or passive) and the eventual pattern of oceanic spreading center segmentation (e.g., Hammond et al., 2013). As continental rifts evolve, volcanic centers within rift valleys often develop a characteristic spacing, or wavelength, such as observed in the Red Sea Rift (e.g., Bonatti, 1985) and within the Afar depression, the Main Ethiopian Rift (MER), and the Kenya (Gregory) Rift of the East African Rift System (EARS) (Fig. 1, 2; e.g., Mohr and Wood, 1976). Based primarily on observations, the surprisingly regular spacing of the volcanic centers within the EARS has been attributed to lithosphere thickness (Vogt, 1974; Mohr and Wood, 1976), pre-existing fault systems, and mantle processes similar to those at island arc and mid ocean ridges (Keer and Lister, 1988). In this project, we investigate the processes that control the spacing of volcanoes in the EARS. We are using numerical experiments to investigate if the surface expression of volcanism is primarily controlled by melt production (e.g., localized mantle instability, variations in mantle temperature and/or buoyancy) or by melt extraction (e.g., thickness of the lithosphere, pre-existing fractures).

The EARS is a perfect natural laboratory to test relationships between volcanism and parameters such as mantle temperature, lithosphere thickness, rift extension rate, and the presence of pre-existing structures. For example, the presence of one or two mantle plumes (Ebinger and Sleep, 1998; George et al., 1998) located primarily under the eastern rather than the western branch (e.g., Mulibo and Nyblade, 2013) suggests a role for anomalously warm, perhaps volatile-rich, mantle controlling the development of volcanic structures beneath the eastern branch rift segments. Additionally, decompression melting of upwelling mantle should be greater beneath the MER, where the opening rate is ~5 mm/yr (Saria et al., 2014), than beneath the Kenya rift, where the opening rate is ~3 mm/yr (Jestin et al., 1994; Saria et al., 2014). Differences in such tectonic and mantle parameters likely regulate magma supply throughout the EARS.

To constrain our experiments, we first examined the distribution of volcanoes throughout the EARS. We find that the median spacing of volcanoes in the Ethiopian and Kenya Rifts are similar (25 km and 32 km, respectively) and relatively uniform (e.g., small inter-quartile ranges, 15-16 km; Fig. 2). The median spacing of volcanoes in the Western Rift is much larger (53 km) and more irregular with an inter-quartile range of 68 km. We also found that volcano spacing may have some correlation with edifice volume, which could indicate a contribution of lithosphere flexure (e.g., Hieronymus and Bercovici, 1999).

Figure 2. The active volcanoes during the last 10 ka of the (A) West, (B) Kenya, and (C) Ethiopian Rift axis. The red and white stars indicate volcanoes centered or offset from the rift axis, respectively. The white number indicates the spacing between volcanoes centered along the rift axis. (D) The median (marked) and inter-quartile range (boxes) in measured volcano spacing increases from the Ethiopian to West sections of the EARS. (E) No consistent relationship exists between spacing and the volume of each volcanoes of the Ethiopian Rift.

For example, spacing of volcanic centers in the MER decreases with increasing volume of the largest volcanoes. However, for smaller volcanoes this trend does not hold; the spacing between volcanoes with a volume ~<10 km3 shows no correlation with volcano volume. Thus, initial volcano formation is likely controlled by deeper processes.

The combination of regular volcano spacing in the Ethiopian and Kenyan Rifts and the presence of relatively warm plume mantle indicate that a Rayleigh-Taylor (RT) instability in the mantle could regulate magma supply along the rift axis. A RT instability occurs in the unstable situation where a dense fluid rests atop a less dense fluid and the interface between them is perturbed; this results in growth of an instability that forms regularly spaced upwelling and downwelling diapirs. The diapirs form at a dominant, or preferred wavelength (i.e., spacing) that is controlled by the fluid parameters (e.g., density contrast, viscosity contrast, layer thickness). For example, when both fluids are Newtonian a larger thickness of the lower fluid layer yields a larger preferred instability wavelength.

To test the hypothesis of a RT instability in the sub-EARS mantle, we developed numerical models of a less dense viscous material (e.g., warm plume mantle) underlying a relatively dense viscous fluid (e.g. non-plume mantle). Simulations are performed with the finite-difference, marker-in-cell code SiStER (Simple Stokes with Exotic Rheologies; e.g., Olive et al., 2016). We simulate the evolution of two fluid layers with different contrasts in density, temperature, and flow law exponent (Newtonian versus Non-Newtonian fluids). We initially perturb the layer interface by 1% of the imposed wavelength and set the box width to half of the imposed wavelength (Fig. 3). By examining a range of parameters, we will be able to address how variations in mantle properties along the Ethiopian and Kenyan rift and between East and West Rifts may control volcano spacing.

Figure 3. For numerical simulations of non-Newtonian fluids, the (A) viscosity is a strong function of the (B) second invariant of the strain rate field. In contrast to Newtonian cases, these sharp changes in viscosity yield a weak dependence on the (C) thickness of the lower layer (colors) for cases with intermediate layer thicknesses. Gray arrows in (A) are velocity vectors.

Our preliminary results with Non-Newtonian fluids demonstrate that the growth rate of instabilities is not controlled by the lower layer thickness as in Newtonian fluids, but by the characteristic distance over which viscosity changes away from the interface between the two fluids, in agreement with previous studies (Molnar et al., 1998; Miller and Behn, 2012). If the lower layer is significantly thicker than this characteristic distance, than the preferred wavelength of upwelling diapirs will not “feel” the effect of the layer limits. However, if the layer is smaller than the characteristic distance, layer thickness will alter the preferred wavelength. Thus, for relatively thick lower layers, the preferred wavelength depends upon other system parameters, such as the flow law exponent.

For values of the lower layer thickness (~10 km), flow law exponent (3-4), activation energy (E ~200-500 kJ.mol-1), and density anomaly (3000 kg.m-3 in the lower layer and 3200 kg.m-3 in the upper layer) that resemble possible mantle conditions beneath the EARS, we find wavelengths on the order of those for the Ethiopian Rift and portions of the Kenya Rift. Although we have not yet incorporated the effect of background strain rate due to rift extension, spatially variable temperature, and more complicated rheologies (e.g., incorporation of a viscous yield stress), our preliminary results suggest that a RT instability in the upper mantle could conceivably control the volcano spacing along the EARS rift segments. In addition to incorporating the above complexities into our simulations, we plan to compare our predictions to seismic, petrographic, and structural studies in the EARS to further constrain the properties that may be required to form RT instabilities in the sub-rift mantle. ■

References
Bonatti, E., 1985. Punctiform initiation of seafloor spreading in the Red Sea during transition from a continental to an oceanic rift. Nature 316, 33-37.
Ebinger, C.J., Sleep, N.H., 1998. Cenozoic magmatism throughout east Africa resulting from impact of a single plume. Nature 395, 788-791.
George, R., Rogers, N., Kelley, S., 1998. Earliest magmatism in Ethiopia: Evidence for two mantle plumes in one flood basalt province. Geology 26, 923-926.
Hammond, J.O.S., Kendall, J.-M., Stuart, G.W., Ebinger, C.J., Bastow, I.D., Keir, D., Ayele, A., Belachew, M., Goitom, B., Ogubazghi, G., Wright, T.J., 2013. Mantle upwelling and initiation of rift segmentation beneath the Afar Depression. Geology, doi:10.1130/G33925.1.
Hieronymus, C.F., Bercovici, D., 1999. Discrete alternating hotspot islands formed by interaction of magma transport and lithospheric flexure. Nature 397, 604-606.
Jestin, F., Huchon, P., Gaulier, J.M., 1994. The Somali plate and the East African Rift System: present-day kinematics. Geophysical Journal International 116, 637-654.
Keer, R.C., Lister, J.R., 1988. Island arc and mid-ocean ridge volcanism, modelled by diapirism from linear source regions. Earth and Planetary Science Letters 88, 143-152.
Miller, N.C., Behn, M.D., 2012. Timescales for the growth of sediment diapirs in subduction zones. Geophysical Journal International 190, 1361-1377.
Mohr, P.A., Wood, C.A., 1976. Volcano spacing and lithospheric attenuation in the Eastern rift of Africa. Earth and Planetary Science Letters 33, 126-144.
Molnar, P., Houseman, G.A., Conrad, C.P., 1998. Rayleigh–Taylor instability and convective thinning of mechanically thickened lithosphere: effects of non-linear viscosity decreasing exponentially with depth and of horizontal shortening of the layer. Geophysical Journal International 133, 568-584
Mulibo, G., Nyblade, A.A., 2013. The P and S wave velocity structure of the mantle beneath eastern Africa and the African superplume anomaly. Geochemistry Geophysics Geosystems 14, 2696-2715.
Olive, J.-A., M. D. Behn, E. Mittelstaedt, G. Ito, and B. Z. Klein (2016), The role of elasticity in simulating long-term tectonic extension, Geophysical Journal International, doi:10.1093/gji/ggw1044.
Saria, E., Calais, E., Stamps, D.S., Delvaux, D., Hartnady, J.H., 2014. Present-day kinematics of the East African Rift. Journal of Geophysical Research 119, doi:10.1002/2013JB010901.
Vogt, P.R., 1974. Volcano spacing, fractures, and thickness of the lithosphere. Earth and Planetary Science Letters 21, 235-252.
Reference information
Investigating mantle controls on volcano spacing along the East African Rift System. E. Mittelstaedt, A. Sibrant

GeoPRISMS Newsletter, Issue No. 37, Fall 2016. Retrieved from http://geoprisms.nineplanetsllc.com

HOBITSS Hikurangi Ocean Bottom Investigation of Tremor and Slow Slip


Erin K. Todd (University of California Santa Cruz) on behalf of the HOBITSS experiment team

The Hikurangi Ocean Bottom Investigation of Tremor and Slow Slip (HOBITSS) experiment is a multi-national collaborative offshore seismic and geodetic research project that explores the relationship between slow slip events (SSEs), tectonic tremor, and seismicity along the shallowest part of the northern Hikurangi Margin where the Pacific Plate is subducting beneath the North Island of New Zealand. An array of 24 absolute pressure gauges (APG), fifteen ocean bottom seismometers (OBS), and three ocean bottom electromagnetometers were deployed between the shoreline and the trench for thirteen months to capture deformation, seismicity, and conductivity changes during large SSEs offshore the North Island’s east coast.

This offshore Gisborne region hosts shallow SSEs (<15 km depth) approximately every eighteen months that typically last from one to three weeks and release energy equivalent to Mw 6.5-6.8 earthquakes. However, to capture vertical deformation with the seafloor pressure sensors, the network needed to be in place during one of the larger SSEs, which only occur every four to six years. With the last very large SSE in the Gisborne region in March/April 2010, choosing the correct time for the deployment was definitely a gamble, as the timing of the large north Hikurangi SSEs is not particularly predictable! Thankfully, the anticipated SSE began in late September 2014 directly beneath the HOBITSS array (Fig. 1). The September 2014 SSE was the second-largest SSE observed on that part of the subduction zone, so we were incredibly lucky to have the seafloor instruments in place at just the right time.

Between the deployment and recovery expeditions, the science party consisted of researchers from the United States, Japan, and New Zealand, marine geophysical instrument engineers from the United States and Japan, and ten graduate students from the United States, Japan, and New Zealand. The experiment was funded by NSF Marine Geology and Geophysics in addition to Japanese and New Zealand funding agencies. These expeditions were the first seagoing experience for many of the graduate students, myself included.

May 2014 – The Deployment

New Zealand’s Research Vessel Tangaroa was used for the deployment cruise. We set out from Wellington and began the 24-hour journey to our deployment site. Those 24 hours were very busy as the engineers began checking over every component of the instruments to ensure they were ready for deployment. As a graduate student on my first scientific cruise, I spent the first day learning my way around the ship, adjusting to ship life, and meeting all the members of the science and engineering parties. While a couple of the grad students had been on scientific cruises before, the rest of us had never been to sea before and didn’t know what would be expected of us or how we would fit in to the deployment procedure. Thankfully, everyone in the science and engineering parties was extremely helpful and, by the time we reached the deployment site, we all knew what to do.

Once the deployment began, the mood on the ship changed. Everyone was focused on the task at hand. The first day of deployment was a whirlwind as we deployed fourteen instruments and recovered four that had been deployed the previous year as part of another experiment. Each step in the deployment procedure was well executed and it was fascinating to watch the exchanges between the leaders of the science party and the engineers as they worked together to determine which instrument would be ready for deployment next, how long it would take to transit to the deployment location, and how long it would take to survey the deployed instruments to pinpoint their final location (Fig. 2). So many moving pieces and steps needed to be completed in the correct order to successfully deploy the instruments with the time and resources available. Prior to the cruise, I had assumed that certain elements of the experiment like the order of station deployment had been pre-determined. I was surprised at the number of decisions that had to be made at the time of deployment based on the immediate resources and weather conditions. Once I was on the ship, I realized how quickly something could happen to change any pre-determined plans.

We were fortunate enough to have good weather for the first few days, but by day 4, the weather took a turn for the worse. Three days into the cruise, we had deployed 24 stations and seemed to be ahead of schedule, but our good fortune came to a swift end when a storm arrived early on the fourth day forcing us to hold position through the storm for 36 hours. With strong winds and heavy swells, deploying new instruments and surveying the locations of previously deployed instruments was out of the question. While some of the grad students had been to sea before, others of us had not and discovered if we were prone to seasickness or not. I was lucky enough to not get seasick, but for others, the storm brought some real challenges. Fortunately, everyone helped each other out to ensure that all essential tasks were covered. Calm weather returned for the last few days of the cruise and we were finally able to deploy the remaining instruments before turning back for Wellington Harbor.


“I learned that if you are going to take sea-sickness medication, it should be well before the research vessel leaves the dock. Preventative measures are key. I learned a lot on the HOBITSS deployment cruise, especially what goes into determining simple parameters that data analysts and grad students like myself take for granted, for instance, the latitude, longitude, and depth of the instrument. Ocean bottom instrument deployment can be more complicated than land deployment, and it was enlightening to see the Principal Investigators work to figure out the next deployment site and manage the experiment. It was good experience to help with the cruise report and determine locations of instruments, as well as learn how to ping the instruments as they sunk to the ocean floor. My advisor arranged a series of science talks on the deployment, so I learned a lot about the context of the experiment, which is really helpful because I will be working with the data. I appreciated the opportunity to meet and work with a variety of scientists from Lamont-Doherty Earth Observatory, the Earthquake Research Institute in Tokyo, Japan, Tohoku University, University of Texas Austin, University of California Santa Cruz, and New Zealand. We had a very international team!”

– Jenny Nakai, Graduate Student, University of Colorado Boulder


“The HOBBITS cruise was quite an unique experience for me. Unlike previous cruises I participated to learn and observe as a student, on the HOBBITS deployment cruise I worked as part of the OBS technical team. My main responsibility was to assemble and service ocean bottom seismometers and pressure gauges to get them ready for a yearlong deployment.
Working together with the OBS team on the deck on a nut and bolt level make me realize the amount of work and level of dedication that goes into deploying each OBS. For example, in order to make sure that the instrument can return to the surface following an acoustic command, two redundant release systems are put in place, both equipped with two sets of redundant wiring. Only one of the four needs to work properly for the system to function, but all four systems need to be quadruple-checked before deployment. Given the harsh environment at the sea floor, we can’t take any chances.”

– Yang Zha, former Graduate Student, LDEO, Columbia University


June 2015 – The Recovery

From the perspective of those of us who had never been on an OBS recovery cruise, the idea of successfully recovering 35 instruments that had been sitting on the ocean floor for thirteen months, accumulating sediment and marine life, seemed daunting. We knew the main Gisborne slow slip event under the array had occurred four months into the deployment and a second slow slip event had been recorded to the south of the array, so there was a lot of anticipation and the Principal Investigators were very eager to get a look at the data.

The United States’ Research Vessel Roger Revelle was used for the instrument recovery cruise. This time, the expedition began and ended in Napier, which is a famous “Art Deco” city on the New Zealand’s east coast. Most of Napier was destroyed in an earthquake in 1931 and was completely rebuilt right after that in the Art Deco style of the time. Napier is very close to the HOBITSS experiment location, so the transit to retrieve our instruments was shorter than for the deployment.

There was a lot of nervous excitement among the team as we arrived on site and prepared to recover the first instrument. What if the instrument was buried by sediment? What if the receiver on the instrument didn’t recognize the release command? What if marine life or sediment had damaged the instrument in some way and it didn’t float back to the surface? What if the battery died during the deployment? What if the pressure case leaked and the instruments were exposed to seawater? The seafloor is a harsh environment for sensitive electronics and there were many things that could have gone wrong.

After the first instrument was brought on board, the tense mood that had gripped the team relaxed and we started to recover instruments in earnest. The seas were calm and the winds were light for the first full day of recovery and nine instruments were recovered. Recovering instruments is a tricky process – even if everything works and the instrument rises to the surface, there are still challenges to getting it on board. As the ship arrives on site, we use the ship’s hull-mounted transducer to communicate with the instrument and send the correct signal for the instrument to release its weights and start rising toward the surface. Depending on the ocean depth, the ascent can take over an hour. During that hour, the ship and instrument communicate back and forth to track the progress of the ascent. Once it is clear that the instrument has reached the surface, we would send out spotters all over the ship to look for the instrument bobbing on the surface. Some of the instruments have small flags attached because when they rise off the ocean floor they would float just below the surface and it would be difficult to locate them without the small pennant flag. As the instrument is spotted, the captain would maneuver the ship alongside it. The technicians and engineers would then use long poles equipped with hooks on the end to grab the instrument and hook it up to the winch to pull it out of the water. Each step requires numerous people doing their part carefully and at exactly the right time.

We were keeping an eye on a storm that was heading our way, threatening to reach us in the middle of the cruise, so we worked quickly to recover as many instruments as possible before the seas got too rough. As the storm hit, we were forced to suspend recovery operations due to high winds and large swells. On one of my shifts, we hit a particularly large swell and everything that wasn’t strapped down went sailing across the room. Chairs toppled over, notebooks and papers went sliding, and a large telephone fell of the table. Thankfully, after one or two stormy days, we were able to resume operations and recover the rest of the instruments. We successfully recovered 34 of 35 instruments: after many attempts over a few days, one of the ocean bottom electromagnetometers was considered lost after it never acknowledged the communication from the ship.

Most of our instruments were deep water (over a thousand meter depth), but five of them were on the shelf, less than one hundred meters water depth. One of the complications with having instruments at such shallow depths is that they quickly accumulate a lot of marine life (Fig. 3). In order to pass the agricultural inspection once back to port, all the instruments had to be thoroughly cleaned of any traces of mud, plant life, or animal life.

Cleaning these instruments became a large part of the graduate students’ jobs during the second half of the cruise. Soft- and hard-bodied organisms, coating every inch of the instruments, had to be removed. The task was messy and smelly but very critical, as we would not have been allowed to re-enter New Zealand with dirty instruments. As we arrived back in to port and the agricultural inspector came on board to check the instruments, they found a small patch of mud about the size of your palm deep in the inside of one of the instruments that had to be cleaned with alcohol and paper towels and placed into a quarantine bag. After cleaning the remaining mud off the instrument, we were given the all clear!

Hard won results

All the hard work to deploy and recover the instruments really paid off in the end! The Absolute Pressure Gauge data showed that the SSE in September 2014 produced a clearly observed 2-7 cm of vertical deformation of the seafloor (Wallace et al., 2016), much more than any of us ever expected. The vertical deformation shows that slow slip occurred to within at least 2 km of the seafloor, and it is possible that slip went all the way to the trench (Fig. 1). The HOBITSS results really help to demonstrate that Absolute Pressure Gauges are a valuable tool for monitoring centimeter-level offshore tectonic deformation. In addition, preliminary results from the seismic data show the existence of tectonic tremor during the slow slip and that the previously observed seismicity increase during the last large Gisborne SSE in 2010 is also present for the 2014 SSE in similar locations (Todd et al. in prep).

Future Projects – 2017 & 2018

In addition to the HOBITSS experiment, there are a number of exciting future projects slated for the Hikurangi subduction margin in the coming years. The shallow nature of these slow slip events will be the target of IODP drilling in 2017 and 2018 (Expeditions 372 and 375), to better understand the physical origins of slow slip and to install borehole observatories to do near-field monitoring. In addition to the drilling experiment, the R/V Marcus Langseth will undertake an NSF-funded 3D seismic survey in early 2018 to image the shallow slow slip source area. Being able to tie the HOBITSS experiment results in with the results of co-located IODP drilling and 3D seismic imaging will be very exciting! ■

“Report from the Field” was designed to inform the community of real-time, exciting GeoPRISMS -related research. Through this report, the authors expose the excitement, trials, and opportunities to conduct fieldwork, as well as the challenges they may have experienced by deploying research activities in unique geological settings. If you would like to contribute to this series and share your experience on the field, please contact the GeoPRISMS Office at info@geoprisms.nineplanetsllc.com. This opportunity is open to anyone engaged in GeoPRISMS research, from senior researchers to undergraduate students.
We hope to hear from you!

Reference information
HOBITSS – Hikurangi Ocean Bottom Investigation of Tremor and Slow Slip. E.K. Todd
GeoPRISMS Newsletter, Issue No. 37, Fall 2016. Retrieved from http://geoprisms.nineplanetsllc.com

E-FIRE Field Institute Alps Summer 2017 | Monviso


Monviso

 icon-location-arrow 44.666˚N 7.110˚E

The Monviso Ophiolite is made up of two intact sections of Tethyan oceanic crust that both reached eclogite facies conditions during subduction and collision of the European margin beneath the African plate. Peak metamorphic conditions of of 2.2-2.6 GPa and 480-550 °C were reached at ~50Ma. Both ophiolite sections are comprised of metasedimentary cover, metabasalt, metagabbro and serpentinized peridotite with varying amounts of deformation and retrogression (particularly in the metabasalts). The lower section is cut by several shear zones which contain blocks of the various lithologies in a serpentinite matrix and show evidence of pervasive fluid rock interaction.

E-FIRE research on this field location aims to understand the duration and distribution of fluid-rock interaction and the sources of these fluids, the age of important metamorphic events, and the preservation of ocean-floor isotopic stratigraphy to eclogite facies. Samples collected include undeformed and unaltered examples of the entire lithologic stratigraphy of the lower ophiolite section, various examples of fluid-rock interaction (veins and detailed transects of metasomatic rinds), rodingites, calcite-bearing metasediments, and examples of exceptional mineral textures (mylonitized to extremely coarse-grained eclogite, static to mylonitized serpentinite).

Sample Photos

Field Photos


Seeking the origins of continents in the western Aleutian island arc


Elizabeth Cottrell (Smithsonian Institution), Katherine A. Kelley (University of Rhode Island), Michelle Coombs (USGS Alaska Volcano Observatory), Elizabeth Grant (University of Washington), Mattia Pistone (Smithsonian Institution), and Katherine Sheppard (UC Santa Barbara)

The origin of Earth’s continents is among the most fundamental of questions facing geoscientists today. Though andesitic in composition, continental crust shares many geochemical characteristics with basaltic lavas erupted at subduction zone arc volcanoes, suggesting that subduction zone magmatism somehow manufactures Earth’s continents. Our project goal is to examine one particular attribute shared by arc magmas and continents, unusually low iron contents (sometimes referred to as “calc-alkaline affinity”). Our work will test the roles of magmatic water content, oxygen availability, and parent magma composition on the development of low iron in arc magmas. With this goal in mind, we conducted a three-week field campaign, from September 4-23, to the far Western Aleutian islands of Buldir, Kiska, Segula, Little Sitkin, Semisopochnoi, Gareloi, Tanaga, and Kanaga, home to some of the most calcalkaline lavas on Earth. The goals of the field program were to collect samples of volcanic airfall deposits (tephra), which may preserve glass inclusions within the igneous phenocrysts that will reveal the water contents and oxygenation conditions of these end-member magmas. We conducted our field work from the home base of the R/V Maritime Maid, which anchored in four harbors among these islands, and used a Bell 407 helicopter to access field sites on these eight volcanoes. On the Maid, our GeoPRISMS team of five (Liz Cottrell, Michelle Coombs, Mattia Pistone, Elizabeth Grant, and Katherine Sheppard) was joined by a team of volcanic gas scientists supported by the Deep Carbon Observatory (Tobias Fischer and Taryn Lopez) and a team of geophysicists and field technicians from the Alaska Volcano Observatory (John Lyons, Dane Ketner, and Adrian Bender) who serviced the USGS seismic network on several of these volcanoes for the first time in more than ten years. Project PI Katie Kelley could not be in the field, but participated remotely via satellite phone and internet tools that allowed her to track the ship, helicopter, and us in nearreal time. Our voyage is a great example of how multiple teams can work together to achieve great things.


– Liz Cottrell

Preparing for Danger: Training in Anchorage

2 September 2015 | Anchorage, AK • We’re here. Anchorage, Alaska. Months of planning and training are behind us. In three days we will take a three hour jet flight to the airstrip that is both farthest East and farthest West in the United States (figure out that riddle!). From there, we will board a small boat, The R/V Maritime Maid, and steam West into the uninhabited islands of the Western Aleutians. We will only have what is in our suitcases and what we shipped months ago – and I am scared. I am scared I didn’t prepare my team. I am scared I don’t have the right equipment. I am scared I will make poor decisions. But I am most scared of this pool I’m in. This is the Learn to Return Aviation Land and Water Survival School, more commonly known as “dunker” training, with the unfortunate slogan “Be the One to Come Home!” And I’m thinking “Can’t we all come home?” In this course, we get strapped into metal seats with five-point
harnesses meant to mimic the fuselage of a plane or helicopter. We hover above the water. My instructor, Clint, barks, “Mayday Mayday! This is Echo Alpha Romeo 289 with two souls on board. We are ditching! Ditching! Ditching!” And then WHAM! The seats flip and I impact the water. I can’t see. I can’t breathe. I follow the routine. (0) Don’t panic. (1) Slide my hand. Find the door latch. (2) Open the door. (3) Anchor my hand in the door frame. (4) Slide my other hand to unfasten my belt and pull myself out. Even now, dry, thinking of Clint’s voice sends chills down my spine. One team member doesn’t pass the course. I think of my two kids and wonder if I should just get on a plane home. But somehow, tomorrow I board my flight to Adak. The R/V Maritime Maid and “2-Mike-Hotel” (the Helicopter)

3 September 2015 | Adak, AK • The heli pad on the Maid looks to be about the size of my desk at work. I wonder how it is that my first ever helicopter experience will be taking off from the back of a boat and going over the Bearing Sea to the rim of a volcano. Am I crazy? Our pilot, Dan Leary, is the most experienced pilot at Maritime Helicopters and the absolute best pilot I could ever have hoped for. I soon understand that Captain George Rains, who has sailed these waters for longer than I’ve been alive, isn’t going to take any unnecessary risks.

Weather Orphans the Helicopter

5 September 2015 | Constantine Harbor, Amchitka, AK • The Maritime Maid left port in Adak yesterday destined for harbor in Amchitka. At the time of our departure, the weather was beautiful with sunny, blue skies and a clear view of a steaming white fumarole at the summit of Kiska. The Maid does not sail with the helicopter parked on the deck. Instead, the helicopter normally flies when the boat is underway and they meet up again in harbor. Our plan yesterday was for the helicopter to meet us when we moored in Constantine Harbor, Amchitka but, as we sailed, fog closed in at Adak and kept the helicopter from following us. We have no scientific interest in Amchitka, so we must wait for the helicopter to join us.

8 September 2015 | Kiska Harbor, Kiska, AK • After four days of separation, we are finally reunited with the helicopter! Two days ago, we decided to lift anchor and head to Kiska harbor in the hopes of starting work, with or without the helicopter, and left a fuel cache on Amchitka so the heli could catch up with us as soon as weather permitted. We made the most of our idle time at Amchitka by taking a small skiff to shore, doing a gear shakedown, and taking some “practice” samples. Likewise at Kiska, we were able to skiff to shore yesterday and explore the area around the harbor, view and sample some distal volcanic deposits, and try not to set of any unexploded ordinances leftover from World War II. Kiska was a WWII battleground, occupied by the Japanese for a time before being re-taken by the US, and the historical remnants litter the ground and harbor.

9 September 2015 | Segula Volcano • My first day of real field work! Because of the remoteness of this region, few geological studies have been done here. Today’s target, Segula, hasn’t been visited by geologists since the 1940’s and there are only three known rock analyses from this volcano. We find a gorgeous exposed tephra section in a wide gully and greedily fill our bags with this “black gold.” By the end of the day, I realize with satisfaction that our work will return precious samples from this volcano ripe for new discoveries. – Liz Cottrell


– Elizabeth Grant

Minefield Kiska

9 September, 2015 | Kiska Island • Team tephra is in search of olivine in mafic tephra and we have split up into two sub-teams today so we can cover more ground. Mattia and I are on Kiska, the third westernmost island in the Aleutian chain. The helicopter drops us off on a relatively flat, topographic low near the northern flank of Kiska Volcano, next to a recent lava flow. As the helicopter flies off to assist the other teams, Mattia and I survey the landscape and geologic map to get our bearings. We quickly realize that what we had assumed to be a relatively easy passing is actually a literal and figurative minefield. Instead of consisting of relatively young olivine-rich basalt, the flow is actually composed of older blocks of andesite, twice as wide as we are tall and covered with plants and grasses that reach up to our waists. Not only that, but Kiska is littered with “UXO,” unidentified explosive ordinances, which could be anywhere. From our topographic low, it takes us 45 minutes to scramble the 40 meters to the top of the lava flow, and we arrive at the top sweating and out of breath. As we survey our progress, it dawns on us that we will not be able to cross the rest of this flow; it’s too large and too dangerous. From the comfort of the ship’s galley, we had routed our path across the map’s page, talking about sampling along the way. In reality, the unexpected size of the lava flow provided us with some much-needed perspective about the unforgiving scale of nature and the long-reaching consequences of human activity.


– Katie Kelley

The Virtual Aleutians

10 September 2015 | Narragansett, RI • I wish I were there. And I don’t. Staring at the computer screen, I wonder for the umpteenth time if I made the right decision to stay home. My baby daughter, Miranda, is only four months old, so I couldn’t have gone. Still, I can’t help but have this internal debate daily. It is mid-afternoon here and they will be starting their day in the field soon. I login to a website to check the location of the Maid and the helicopter, both of which pop up on an animated map of our field area. When the helicopter is in flight, it lights up pink and its little propeller turns as it moves across the screen. Watching this is the most exciting part of my shore-based experience.

My phone rings and the caller ID shows “Liz Sat Phone.” Liz says it is raining and I can hear the raindrops over the phone. It seems always to be raining there; she says the volcanoes make their own weather. We quickly debrief on yesterday’s work and go over a plan for the coming day’s activities: our party will deploy one team to Kiska, and the other to Buldir. Buldir is the riskiest flight of the trip, partly because the flight itself is extremely dangerous and partly because they might not find anything useful when they get there, so they are risking life and limb possibly for naught. I am incredibly nervous for them. After we hang up, I login to another website to track Liz’s InReach device, which sends her location every ten minutes. I leave the office just as the helicopter leaves the Maid for Buldir.

Of course, Liz tried to contact me from Buldir while I picked up my children from day care, during the only ten-minute window of my day when I had to pocket my phone. They made it safely there, which is a relief, and I briefly text with Liz’s husband, who is also closely tracking her steps, about how wild it is to watch her walking around. When I get home, we setup my laptop at the dinner table (the only time a computer has ever been allowed at the table, mind you) so my whole family can watch the “action” as it happens. My three year-old daughter has learned the names of all of the volcanoes on the itinerary and asks where Liz and the helicopter are today.


– Mattia Pistone

Kiska Volcano: Ascensus ad coelum et descensus ad Inferos

10 September 2015 • Thirty minutes prior to sunrise. From the vessel bow, while sipping hot tea, I observe that low-elevation clouds still seal the sky. These are not ideal conditions for helicopter flight but this is our last day on Kiska Island and, despite numerous attempts on the flanks, we have yet to find any of the rocks (mafic tephra) that we are looking for. We can only hope to find a fissure in the cloud barrier and find a way to the volcano summit. The wind is with us, however, and it is rapidly clearing up the sky from the dusty clouds. Today, the first team to be deployed by helicopter is the gas team (Tobias Fischer, Taryn Lopez) supported by Adrian Bender, the sedimentologist of “tsunamites” and “stormites,” who is going to be the “radio antenna man” in contact with the Maid while the group collects dangerous volcanic gases on the southwest flank of the volcano summit. The helicopter is fully packed with people, backpacks, and field instruments. There is only one free seat for one person with a backpack. After briefing with the other members of team tephra, it is unanimously decided that I will join the gas team today. I will be tasked with finding and returning rocks from the volcano summit back to the research vessel. I am thrilled! After taking off, our helicopter pilot Dan Leary is like a hawk looking for prey; he finds a spot with broken clouds and steers into it. Thanks to the ascending winds increasing while approaching the hidden east flank of the volcano, we are promptly above the clouds – the sky can also be blue here in the Aleutians. While ascending, the northwest wind is too strong to make any attempt for landing at the volcano summit. Therefore, we are all deployed at about a thousand feet below the volcano summit. It looks like we will have to reach the summit only with some effort and sweat. After a short briefing about work tasks and timetable, and radio communications, the gas team and myself initiate our hike up. Lava flows, loose volcanic bombs and blocks dominate the landscape. After several days at low elevation, I can enjoy this hike without fear of encountering UXO. I am at the top of the crater rim and the landscape in front of me is gorgeous! The volcano crater is in front of me and I feel so small and insignificant. Clusters of loose rocks cover the internal flanks of the volcano. The crater floor is filled with fine volcanic material; it looks like mud. The western side of the volcano has no rim and from there, low-elevation clouds ascend and enter this amphitheater while the northwestern winds blows. I am the lonely spectator of this volcanic show and feel like an explorer – I am the first one to set foot in this volcanic crater… well, after the geologist Robert Coats, who most probably came here during his mapping work in the early 50’s… but, for sure, I am the first Italian here! That’s exciting! Now, back to work. I report the GPS coordinates and field
observations in my book and start to hammer the samples I need. Any sample I take looks beautiful and full of precious information. I wish to take any and all specimens with me since this is the first and last chance we have to collect rocks in the crater of Kiska Volcano during this field mission. But I have to face the reality: I am by myself and cannot carry too many rocks. How time flies! I am quick to collect samples, observations, and data because I have to go back soon. We have now 70 kg of rocks to hike to our helicopter rendez-vous location and I anticipate a very negative reaction from the gas team, who have worked hard for many hours. Instead, I receive generous support, which is typical of an enthusiastic team of people. This is the best reward after a long day of work between volcanic rocks and wind gusts. Together, we march back to the pick-up point. I think this is the greatest day of the field mission here in the Aleutians.


– Katherine Sheppard

On the Edge

10 September 2015 | Kiska Harbor, Kiska, AK • Buldir is a tiny speck of an island about halfway between the much larger masses of Kiska and Attu, all the way out in the far Western reaches of the Aleutian chain. How far out? Let’s just say we didn’t have our passports with us, so we couldn’t except to legally get much further west. There are 45 miles of open water to the east and west of Buldir, which was about a 45-minute flight for our Bell 407 helicopter. This is a perfect amount of time to reminisce about three things: we would be among only a few geologists to visit the volcano in decades, we only had one day to do as much work there as we possibly could, and if anything went wrong while on the island we were all royally screwed. Our day on Buldir had the potential to be the most dangerous day of the trip, mostly due to the long over-water helicopter flight and the remote location. If the helicopter landed but couldn’t take off due to bad weather,
we would be stuck out there until the weather cleared or the boat came to get us. As anyone familiar with the weather in the Aleutians knows, this could take a very, very long time.

As it turned out, we landed, did our work and I soaked in the glory of feeling like a real life explorer. The fog stayed at a respectful distance, the wind stayed manageable, and we were able to take off at the end of the day with minimal excitement. When we landed on the boat 45 minutes later, however, we were ecstatic. We had found amazing tephra samples that suggested an explosive, volatile-rich history for Buldir. Not at all as we were led to expect before the trip, so a resounding success! Only when we had unpacked all the rocks and rid ourselves of our protective gear did our helicopter pilot turn to Liz, let out a breath he seemed to have been holding all day, and say “I am never, ever, ever doing that again.”


– Liz Cottrell

12 September 2015 | Semisopochnoi • With the stressful overwater flight to Buldir behind me, I find myself relaxed and enjoying the flight to Semisopochnoi Volcano. A survey from the air reveals beautiful sections of tephra cut from the vegetated landscape. Michelle and I are able to sample meticulously here all day.

17 September 2015 | Gareloi • I am standing waist-deep in olivine scoria and loving it. Katherine and I fill our sampling bags to bursting and I know we have gotten what we came for. I then hike up to the crater rim – just to take a peek. I am stunned at what I see… a crater lake and active fumaroles! This appears to be a new development since the last time geologists visited this place in 2005 and I am reminded that these are indeed very active volcanoes.


– Michelle Coomb

20 September 2015 | Kanaga • Gas team and two tephra teams got set on Kanaga in the morning, and then boat transited from Hot Springs Bay on Tanaga to the Bay of Islands on the west side of Adak. This was the most spectacular day of the trip so far. Kanaga was completely out and cloud free and I took many beautiful photos. Kanaga is a great island and volcano – deep blue lake in the caldera, spectacular lava flows, deep green grass everywhere. Kanaton Ridge is just screaming out for more and better work, as is the entire island. Visited a few tephra sections as guided by CW’s paper and found some big lapilli pumice falls. No mafic scoria to speak of, unlike Tanaga, and much to our team’s disappointment. I think I found two mafic ashes that may be from Tanaga, which will be interesting to see. We ended the day around 5 pm at the hot springs.■


“Report from the Field” was designed to inform the community of real-time, exciting GeoPRISMS -related research. Through this report, the authors expose the excitement, trials, and opportunities to conduct fieldwork, as well as the challenges they may have experienced by deploying research activities in unique geological settings. If you would like to contribute to this series and share your experience on the field, please contact the GeoPRISMS Office at info@geoprisms.nineplanetsllc.com. This opportunity is open to anyone engaged in GeoPRISMS research, from senior researchers to undergraduate students.
We hope to hear from you!

Reference information
Seeking the origins of continents in the western Aleutian island arc
GeoPRISMS Newsletter, Issue No. 36, Spring 2016. Retrieved from http://geoprisms.nineplanetsllc.com

Investigating older rocks in the oceanic Aleutian volcanic arc east of Adak


Peter Kelemen (Columbia University, LDEO) on behalf of Merry Yue Cai (Columbia University, LDEO), Emily H.G. Cooperdock (UT Austin), Steve Goldstein (Columbia University, LDEO), Matt Rioux (UC Santa Barbara), and Gene Yogodzinski (University of South Carolina)

Benefiting from the NSF GeoPRISMS community platform in the Aleutian volcanic arc in the summer of 2015, our group from the University of South Carolina and Columbia University had a
matchless opportunity to study and sample outcrops of pre-Holocene volcanic and plutonic rocks on Unalaska, Umnak, and Atka Islands. Speaking for myself, at the age of 59 and having worked in the field in a lot of spectacular places – every year for forty years – this was one of the most memorable and rewarding field seasons of my life.

The older rocks in the Aleutian volcanic arc are notable because they include the most extensive outcrops of plutonic rocks in any oceanic arc, worldwide. Aside from the visionary work of Sue and Bob Kay and their colleagues, these plutonic rocks have not received much attention since pioneering USGS studies were completed in the 1950’s (Umnak), 1960’s (Unalaska), and 1970’s (Atka). This prior work demonstrated that the Eocene to Miocene plutonic rocks east of Adak Island were more strongly “calc-alkaline”, with higher SiO2 at a given Mg/Fe ratio, compared to the “tholeiitic”, Holocene volcanic rocks on the same islands.

In a recently published pilot study using USGS samples (Cai et al., Earth Planet. Sci. Lett. 2015), we found that these plutonic rocks are also isotopically distinct from the lavas on the same islands, demonstrating that the two suites were generated by melting of two distinct sources.

Our field season in the summer of 2015 was designed to investigate whether these differences in source composition were the result of :

  1. temporal evolution of the arc, in which case Miocene to Eocene lavas should have isotope ratios similar to those of calc-alkaline plutons, and perhaps will also mirror the calc-alkaline compositions of these plutons, or
  2. distinct processes, in which viscous, SiO2– and H2O-rich, calc-alkaline, andesitic magmas tended to stall and form mid-crustal plutons, while relatively low viscosity, SiO2– and H2O-poor, tholeiitic, basaltic magmas tended to erupt on the surface, in which case Miocene to Eocene lavas may be isotopically (and compositionally?) distinct from coeval plutons.

To this end, we hoped to sample coeval plutonic and volcanic arcs on several Aleutian islands where the plutons are well-exposed.

Our starting plan was to set up fly camps in the alpine terrain on the islands, which is underlain by extensive outcrops of granodiorite and diorite plutons. We assumed that we would have difficulty obtaining ages on highly altered volcanic rocks, whereas it would be relatively easy to date zircons from the large plutons. Thus, we expected to sample volcanic rocks where they are intruded by plutons of known age. Frankly, my expectations about the field work were not high. I imagined we would be semi-lost in perennial fog, while disconsolately scraping moss, lichen, and tundra grasses off texture-less, fine-grained, grey-green outcrops, and spending a lot of time arguing about whether a specific sample was volcanic, plutonic, or even sedimentary!

Merry Cai, Steve Goldstein, Gene Yogodzinski, and I flew to the commercial airport in Dutch Harbor on Unalaska Island on August 5, where we were joined by pilot Sean Charlton in Pollux Aviation’s R44 helicopter. Sean had flown out from the mainland, with floats fully inflated. I had never used such a small, gasoline-powered helicopter, with an engine not much larger than a lawnmower, so I was a bit skeptical at first. We initially focused on the Shaler pluton on Unalaska, which is the largest in the Aleutians, and hence in any oceanic volcanic arc, worldwide. The weather was quite good when we were there, which allowed us to fly every day. Everyone says the Aleutian weather is bad and unpredictable, and of course, it is, but not always. Working there can often be quite nice. We set up a couple of fly camps, and ranged through the beautiful alpine terrain, examining complex border facies of granodiorite, diorite and volcanic hornfels. We also took advantage of the helicopter on re-supply days to make ground stops along the coast. There, we found exceptional outcrops, including surprisingly fresh volcanic rocks with chilled margins, suitable for 40Ar/39Ar geochronology.

After a while, the exceptional coastal exposures, coupled with the convenience of the helicopter, induced a change in our plans. We moved into the hotel in Dutch Harbor, and flew every day. It
turned out that world-class sea cliff outcrops, coupled with wave cut terraces that offered ideal helicopter landing sites at all but the highest tides, provided a spectacular opportunity for us to conduct comprehensive sampling.

As the photos accompanying this article show, the Aleutian sea cliffs revealed spectacular sequences of pillow lavas, pyroclastic deposits, and columnar-jointed sills. Indeed, photos in the USGS Bulletins showed some of these exceptionally well-exposed features, but in earlier years, without a helicopter, these outcrops were very difficult to access from small boats. In addition, there were few opportunities to obtain reliable ages on the lavas. With the helicopter, and some confidence about 40Ar/39Ar dating of fine-grained volcanic rocks, we were in heaven. Further, as it turns out, our samples from the many sills intruding the volcanics will provide plenty of opportunities to check the Argon ages using U/Pb in zircon.

As it turned out, the R44 helicopter was perfect for us, fitting easily into small landing spots, often within ten meters of the Pacific surf. Unfortunately, Steve Goldstein came down with shingles and had to convalesce in Dutch Harbor, sampling volcanic rocks from the extensive road network when he could. However – sorry Steve! – this did reduce our helicopter-supported group to three, who just fit into the three passenger seats in the R44, enabling ultra-efficient field work. We would leapfrog along the coast, setting out one or two people at each landing spot, and scheduling pickups a few hundred meters further along the coast.

In the middle of August, we moved from Unalaska to Umnak Island, where we were fortunate to stay in a bunkhouse at Bering Pacific Ranches, Ltd., near the abandoned WWII airfield at Fort Glenn. This is a fascinating operation; while we were there, Ranch owner Pat Harvie and his crew were preparing to round up thousands of “organic, free-range” cattle from across the island, using a fleet of R22 helicopters, plus a lot of bailing wire and duct tape. These animals were destined for shipment to Canadian markets in the late summer and early fall. We all hope this visionary operation ended in great success!

From this spectacular basecamp, we spent several productive days sampling along the north and southeast coasts of the island, with a side-trip to the rim of the giant Okmok caldera during a clear spell. We also used the opportunity to access the westernmost peninsula of Unalaska Island, completing our extensive sampling there. All too soon, it was time to leave the Ranch. We returned to Dutch Harbor, where we met Captain George Rains, the crew of the R/V Maritime Maid, and pilot Dan Leary with Maritime Helicopters’ Bell 206 Long Ranger. We also rejoined a rejuvenated Steve Goldstein, together with his daughter, Emily Cooperdock, who had flown up to join us. This increase in our group size corresponded with the change from the four-seat R44 to the six-seat 206, and as a result we remained a highly efficient, helicopter-supported team!

We moved into comfortable quarters onboard the Maid and, delayed by weather, spent a few more days living on the ship in Dutch Harbor, continuing to sample on Unalaska Island. Until this point, we had not lost a single day to weather, though we had gotten wet on a couple of days.

However, our transit to Atka Island, and our work there, were substantially delayed by wind, then fog. A side benefit was a spectacular morning at anchor among the Islands of Four Mountains,
where we photographed the perfect strato-volcanoes there while we waited for the helicopter to catch up with the ship. Finally, the weather cleared and we spent a highly productive day and a half
racing along the western peninsula of Atka Island, acquiring a fantastic set of samples, including previously dated intrusions that span the range from the youngest (9 Ma) to oldest (39 Ma) plutons known in the arc east of Adak.

We then set out for Adak Island. In the airport there, we greeted the next group who would use the GeoPRISMS community platform onboard the Maid, led by Liz Cottrell. We wished them all the best and, sadly, began the long trip home.

In addition to the pilots, and the crew of the Maritime Maid, we would like to express deep gratitude to Program Manager Jenn Wade at NSF, who worked tirelessly to make the community platform concept come alive, and to Christie Haupert, Alaska Science Project Manager for Polar Field Services, Inc., who provided flawless logistical support.

Preliminary data on a few 2015 samples, Unalaska Island.

PS: Since that time, we’ve been working hard processing our samples and obtaining initial data. On the left is a plot of some early, major element analyses of our samples from Unalaska Island. Note that, as for the USGS samples we analyzed for our pilot study (Cai et al., Earth Planet. Sci. Lett., 2015), most of our 2015 plutonic samples are calc-alkaline and most of our 2015 mafic lava samples are tholeiitic, despite the fact that the 2015 lavas and plutons are approximately coeval. This suggests that the chemical differences documented by Cai et al. (2015) are present among coeval igneous rock suites in the Aleutians, and did not arise as a result of temporal evolution of both volcanic and plutonic magmatism.

In addition to our main line of inquiry, outlined above, we are evaluating the potential for study of detrital zircons in volcanoclastic sediments, while Emily Cooperdock is preparing a proposal to study the uplift and denudation history of the Aleutians via U-Th-He thermochronology as well as fission track and 40Ar/39Ar analyses. ■

A) Schematic map of the Aleutian island arc, sampled areas are highlighted in black. B) Wt% SiO2 versus Fe/Mg ratio of studied Aleutian igneous rocks. By convention, the Fe/Mg ratio is calculated using wt% MgO and FeO, with all Fe as FeO. C) Present-day Nd and Pb isotope ratios of Aleutian igneous rocks vs. longitude and vs. age. Circles are central and eastern Aleutian volcanics: Yellow = Rat and Delarof Islands, Green = Adak and Kanaga, Blue = Atka, Purple = Umnak, White = Unalaska. Error bars are smaller than the symbols. In 3) and 4), the Holocene volcanics are separated by location only without age differences. Figures from Cai et al., Earth Planet Sci. Lett. 2015.

“Report from the Field” was designed to inform the community of real-time, exciting GeoPRISMS -related research. Through this report, the authors expose the excitement, trials, and opportunities to conduct fieldwork, as well as the challenges they may have experienced by deploying research activities in unique geological settings. If you would like to contribute to this series and share your experience on the field, please contact the GeoPRISMS Office at info@geoprisms.nineplanetsllc.com. This opportunity is open to anyone engaged in GeoPRISMS research, from senior researchers to undergraduate students.
We hope to hear from you!

Reference information
Investigating older rocks in the oceanic Aleutian volcanic arc east of Adak
GeoPRISMS Newsletter, Issue No. 36, Spring 2016. Retrieved from http://geoprisms.nineplanetsllc.com

Islands of Four Mountains to Unimak: From the slab to the surface


Report retrieved from the website of the Department of Terrestrial Magnetism Carnegie Institution of Washington and the Facebook page of the field mission (IFM-Unimak 2015: From the Slab to the Surface)

Scientists have a relatively good understanding of the processes occurring in the upper portions of the Earth’s crust that lead to volcanic activity. However, much remains unknown about
how these shallow processes are controlled by the large-scale tectonics and deep mantle processes that are ultimately responsible for volcanism.

A NSF-funded group led by DTM seismologist Diana Roman headed to Alaska for three weeks,two of which were spent on the research vessel Maritime Maid, to collect seismic data in the Islands of the Four Mountains and tephra samples throughout the eastern Aleutians. The group included Roman and DTM postdoc Amanda Lough, as well as Dan Rasmussen, Alex Lloyd, and Terry Plank from Columbia University’s Lamont-Doherty Earth Observatory, Pete Stelling from Western Washington University, and John Power, John Lyons, Christoph Kern, and Cindy Werner from the U.S. Geological Survey.

The goal of their work is to determine how the amount of water dissolved in magma affects where, and for how long, magma is stored in Earth’s crust. This information is critical for accurately
forecasting volcanic eruptions and understanding the large-scale processes that lead to volcanism in Earth’s subduction zones. The volcanoes targeted in this study have a wide range of magma water contents, magma storage depths, and depths of seismic activity, making them ideal candidates for this research.

Roman led another trip in the summer of 2016 to retrieve seismic equipment from the Islands of the Four Mountains. ■

“Report from the Field” was designed to inform the community of real-time, exciting GeoPRISMS -related research. Through this report, the authors expose the excitement, trials, and opportunities to conduct fieldwork, as well as the challenges they may have experienced by deploying research activities in unique geological settings. If you would like to contribute to this series and share your experience on the field, please contact the GeoPRISMS Office at info@geoprisms.nineplanetsllc.com. This opportunity is open to anyone engaged in GeoPRISMS research, from senior researchers to undergraduate students.
We hope to hear from you!

Reference information
Islands of Four Mountains to Unimak: From the slab to the surface
GeoPRISMS Newsletter, Issue No. 36, Spring 2016. Retrieved from http://geoprisms.nineplanetsllc.com

Magnetotelluric & seismic investigation of arc melt generation, delivery, and storage beneath Okmok volcano


Ninfa Bennington (U. Wisconsin-Madison), Kerry Key (Scripps Institution of Oceanography), and USGS Investigators Matthew Haney and Paul Bedrosian

Okmok Volcano - Umnak Island in the eastern Aleutian islands of Alaska
Fore more information about the project, videos, photos, updates, visit the blog

Okmok is one of the most active volcanoes in the Aleutian arc and hosts a 10 km diameter caldera. The subdued topography of Okmok, relative to other Aleutian volcanoes, improves access and permits dense sampling of the volcanic edifice. We have selected Okmok as the site of study for this project due to frequent volcanic activity and the presence of a crustal magma reservoir as inferred from previous seismic studies. At least two caldera forming eruptions are recognized and Okmok is believed to be representative of volcanoes both within the Aleutian arc and worldwide, where long periods of effusive eruptions are punctuated by much larger explosive caldera forming eruptions.

We are applying geophysical techniques to characterize the magmatic system beneath Okmok. During the summer of 2015, we collected onshore and offshore magnetotelluric (MT) data and installed a temporary year long seismic deployment. The seismic instruments will be retrieved in summer 2016. These new geophysical data will be used to test hypotheses regarding the role of slab fluids in arc melt generation, melt migration within the crust, and the crustal magmatic plumbing and storage system beneath Okmok Caldera.

Offshore MT Field Deployment

After numerous delays due to thick fog typical of the Aleutians, the entirety of the offshore MT crew arrived to Dutch Harbor, AK and was assembled on the R/V Thompson. On June 18, 2015, the team departed Dutch Harbor for their first offshore MT site. The offshore crew spent the day preparing receivers so that there were only a few remaining steps to complete before deploying them over the side of the ship. By June 20, all 54 MT receivers had been deployed well ahead of schedule.

With the MT deployment complete, the team collected multi-beam bathymetry data on the upper forearc slope south of Umnak Island using the ship’s EM302 multi-beam echo sounder. On top of mapping the bathymetry of the ocean floor, the intensity of these recordings can be used to help determine the nature of the seabed (e.g. sediments versus hard rock). On June 21, the offshore team transited back to Dutch Harbor via Umnak pass. This return route included spectacular views of Mount Makushin Volcano on Unalaska Island.

Onshore MT and Seismic Deployments

On June 23, having returning to Dutch Harbor from offshore MT work, co-PI Key and Scripps graduate student Georgiana Zelenak joined up with the rest of the onshore team (PI Bennington, UW-Madison post-doc Summer Ohlendorf, and USGS collaborators Matthew Haney and Paul Bedrosian) and departed for Umnak Island. The onshore work was based out of Bering Pacific Ranch at Fort Glenn, an abandoned WWII military base, with a helicopter transporting the seismic and MT teams and equipment during the 19 days of field operations.

After the team arrived at Fort Glenn, the camp house was set up and seismic and MT equipment were prepared for the start of field operations the following day. Seismic and MT field operations commenced on June 23 and extended until July 11. The seismic team installed thirteen temporary broadband seismometers both in and around the Okmok Caldera. In tandem with the Alaska Volcano Observatory’s twelve permanent seismic stations, there are now twelve seismic instruments within or at the rim of the caldera and 14 seismic instruments outside the caldera. The temporary array will record seismic data until its retrieval in summer 2016. Onshore magnetotelluric data were collected in a 3D array using a combination of long-period and wide-band MT systems, with 19 stations within the caldera and ten stations outside. Following the completion of onshore fieldwork, part of the onshore team (PI Bennington, Summer Ohlendorf, and USGS collaborators Matthew Haney and Paul Bedrosian) caught a charter flight back to Dutch Harbor. Co-PI Kerry Key and graduate student Georgie Zelenak hitched a more unconventional ride when the rescue boat from the RV Sikuliaq picked them up from Umnak Island.

Offshore MT Instrument Recovery

Following completion of onshore MT work, the offshore MT team made a six day cruise on the new R/V Sikuliaq to recover offshore MT instruments. Of the 54 offshore deployments, 53 instruments were successfully recovered while one instrument was lost in Umnak pass due to strong tidal currents in the shallow water. ■

“Report from the Field” was designed to inform the community of real-time, exciting GeoPRISMS -related research. Through this report, the authors expose the excitement, trials, and opportunities to conduct fieldwork, as well as the challenges they may have experienced by deploying research activities in unique geological settings. If you would like to contribute to this series and share your experience on the field, please contact the GeoPRISMS Office at info@geoprisms.nineplanetsllc.com. This opportunity is open to anyone engaged in GeoPRISMS research, from senior researchers to undergraduate students.
We hope to hear from you!

Reference information
Magnetotelluric & seismic investigation of arc melt generation, delivery, and storage beneath Okmok volcano
GeoPRISMS Newsletter, Issue No. 36, Spring 2016. Retrieved from http://geoprisms.nineplanetsllc.com

A Field Campaign to the Aleutians


Field work in the Aleutian Islands is complex, expensive, and thoroughly exciting. When the community suggested to NSF that we facilitate a collaborative field platform to get safely to and from the many islands of interest along the arc, we turned to our colleagues in the Division of Polar Programs (PLR). They helped us coordinate, along with the USGS and Alaska Volcano Observatory (AVO), a combined logistics platform of ship and helicopters that could support the science proposed by our eager PIs.

Planning began in the summer of 2014, as we looked at the proposals that had come into the GeoPRISMS deadline focused on work in Alaska and the Aleutians. What was funded from that round was a group of well-reviewed proposals that together we felt had a chance to make real progress on the goals laid out in the Science and Implementation Plan. We got to work with the PIs, the USGS & AVO, Polar Field Services (who would manage the logistics), and PLR to set up the work, get everyone permitted, and get our scientists in the field. We leveraged funds from a number of places to make this work. EAR and OCE, via the GeoPRISMS Program, funded the bulk of the platform. The Directorate for Geosciences (GEO) contributed funds as well. The GeoPRISMS project shared mobilization costs with a previously-funded Arctic Social Sciences project. The Polar Geospatial Center generated DEMs and maps to help researchers better target their time on these remote islands.

In the summer of 2015, three teams of academic researchers along with scientists from the USGS & AVO set off on unprecedented coordinated research in the Aleutian Islands. They shared ship and helicopter time aboard the Maritime Maid, a helicopter-capable research vessel that traveled along more than 800 miles of volcanic arc, from Dutch Harbor in the east to Buldir Island in the west, transporting scientists and equipment on and off the islands. The USGS, already involved in assisting our scientists with permitting and field expertise, also funded their own helicopter time to service monitoring stations on volcanoes, some of which hadn’t been visited in many years. The Deep Carbon Observatory, funded by the Sloan Foundation, provided additional support for a fourth team of researchers to occupy the remaining free berths on the Maritime Maid, maximizing the efficiency of the ship and the potential for real scientific progress.

Field work included rock and gas sampling from numerous volcanoes, as well as geophysical deployments (seismic and magnetotelluric) via this joint logistics platform and parallel-funded projects in the eastern part of the arc. The scientists involved were interested in a range of topics, including magma storage beneath the volcanoes, the chemistry and style of eruptions, and earthquake and tsunami hazards in the Pacific.

This multidisciplinary, multi-scale, collaborative work has already and will, in the future, yield remarkable results that help forward the goals laid out in the GeoPRISMS Science and Implementation Plan. The researchers returned home (mostly) unscathed and very scientifically successful, and both NSF and the USGS have praised the endeavor which uniquely coordinated resources to accomplish the goals of two federal agencies. The GeoPRISMS Program estimates that we saved nearly a million dollars by leveraging what we could, partnering with experts, and being strategic in our thinking, funding, and planning.

– Maurice Tivey
GeoPRISMS Program Manager, National Science Foundation

Magnetotelluric & seismic investigation of arc melt generation, delivery, and storage beneath Okmok volcano

Magnetotelluric & seismic investigation of arc melt generation, delivery, and storage beneath Okmok volcano

Ninfa Bennington (U. Wisconsin-Madison), Kerry Key (Scripps Institution of Oceanography), and USGS Investigators Matthew Haney and Paul Bedrosian Okmok is one of the most active volcanoes in the Aleutian arc and hosts a 10 km diameter caldera....
Islands of Four Mountains to Unimak: From the slab to the surface

Islands of Four Mountains to Unimak: From the slab to the surface

Report retrieved from the website of the Department of Terrestrial Magnetism Carnegie Institution of Washington and the Facebook page of the field mission (IFM-Unimak 2015: From the Slab to the Surface) Scientists have a relatively good understanding...
Investigating older rocks in the oceanic Aleutian volcanic arc east of Adak

Investigating older rocks in the oceanic Aleutian volcanic arc east of Adak

Peter Kelemen (Columbia University, LDEO) on behalf of Merry Yue Cai (Columbia University, LDEO), Emily H.G. Cooperdock (UT Austin), Steve Goldstein (Columbia University, LDEO), Matt Rioux (UC Santa Barbara), and Gene Yogodzinski (University of South...
Seeking the origins of continents in the western Aleutian island arc

Seeking the origins of continents in the western Aleutian island arc

Elizabeth Cottrell (Smithsonian Institution), Katherine A. Kelley (University of Rhode Island), Michelle Coombs (USGS Alaska Volcano Observatory), Elizabeth Grant (University of Washington), Mattia Pistone (Smithsonian Institution), and Katherine Sheppard...