North America’s largest recorded earthquakes and largest documented volcanic eruptions both take place in southwest Alaska. A major shoreline-crossing community seismic experiment commenced in 2018, focused on the Alaska Peninsula subduction zone. Alaska is a GeoPRISMS primary site and EarthScope target. The deployment is augmented by deployment of EarthScope Transportable Array (TA) seismic stations, earthquake and volcanic monitoring networks, and the development of a large pool of ocean bottom seismographs (OBSs). Together, these resource provide a unique opportunity to advance understanding of Alaska and subduction processes generally.
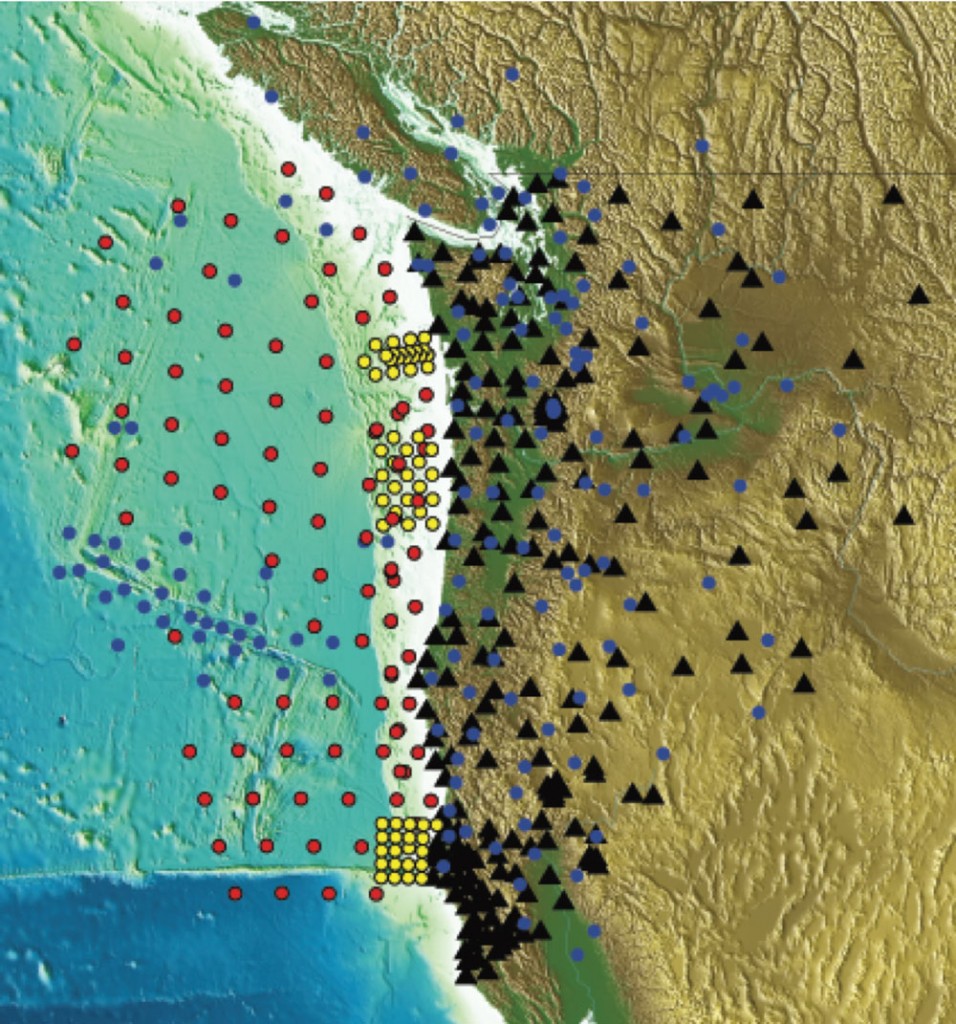
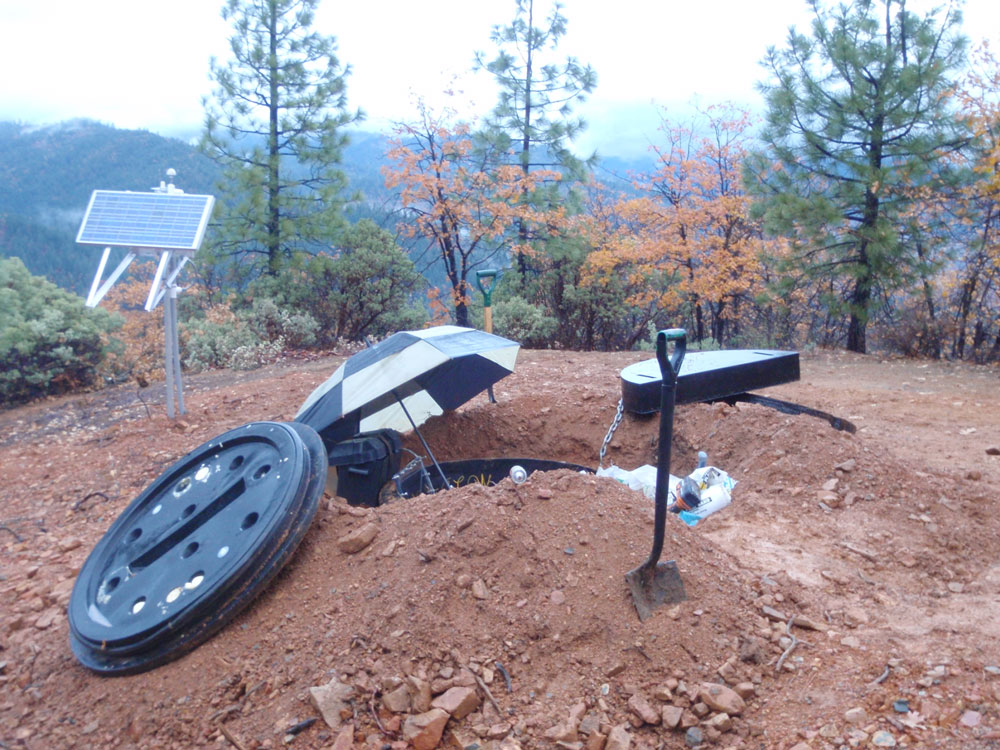
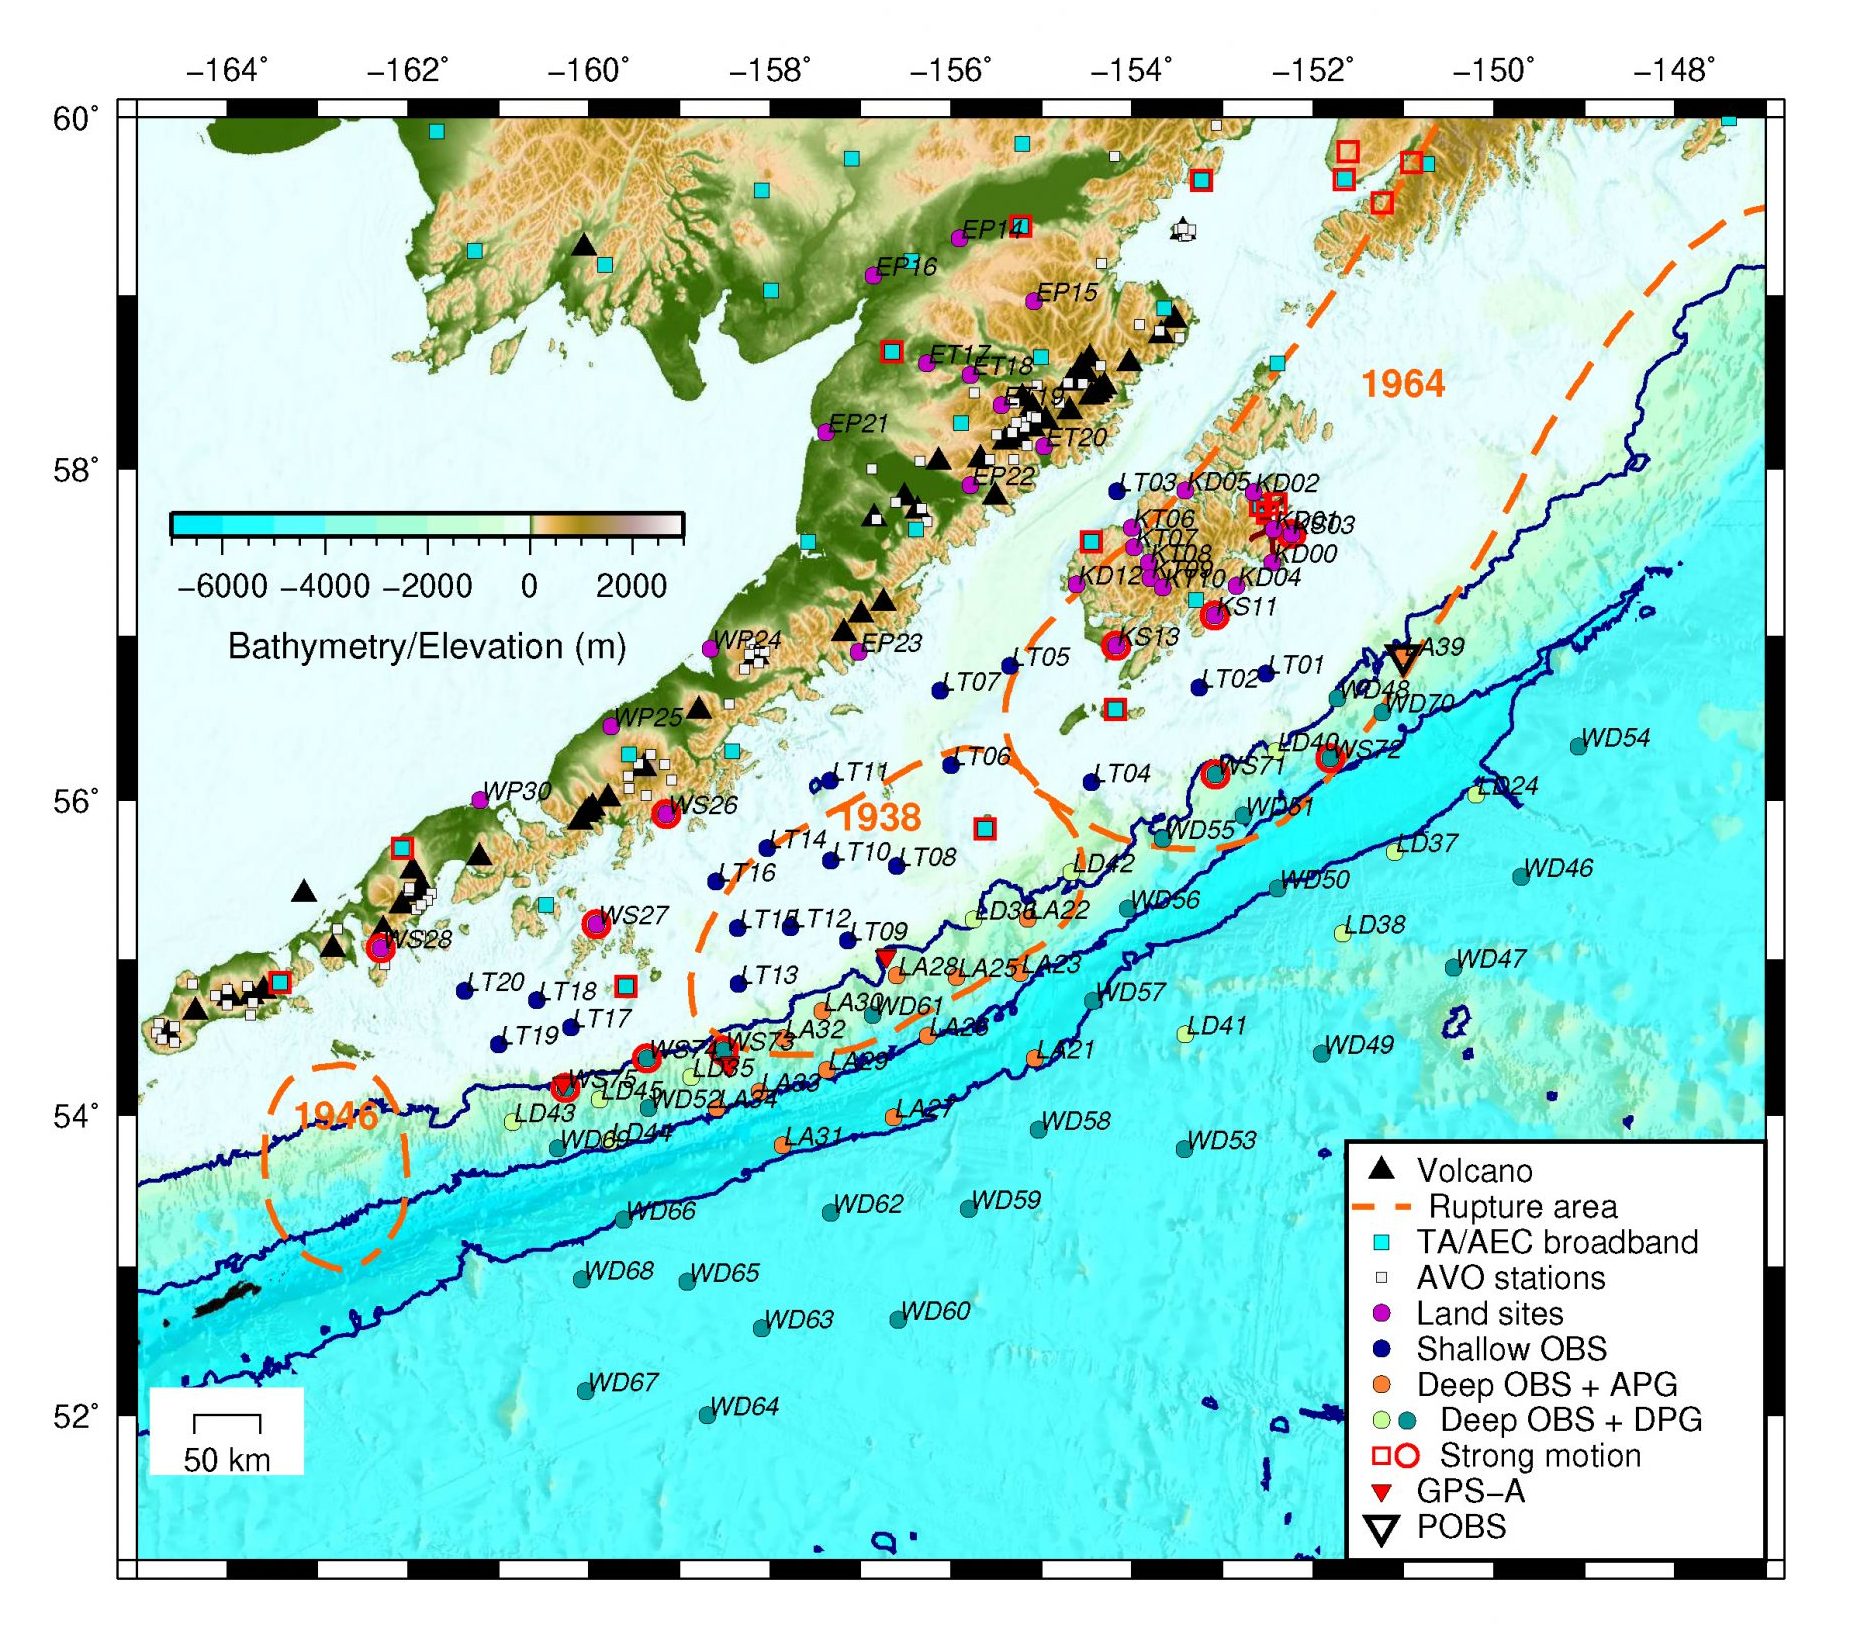
The Alaska Amphibious Community Seismic Experiment (AACSE) collects seismic data remotely onshore and offshore, all of which have been freely released to the community. The array includes 75 broadband OBSs and 30 land broadband sensors, recording for 15 months beginning May-June 2018. The array covers a broad area that spans the incoming plate, the megathrust and volcanic arc to the distal backarc, and includes a dense transect in the Kodiak/Katmai region. When integrated with the TA, the array extends 1500 km from incoming plate to the Arctic coast and spans 700 km along strike. The OBSs include 20 shielded sensors for deployment in shallow water. Many OBSs include absolute pressure gauges to capture possible slow slip events, while five OBSs and six land sites will include accelerometers to record large local earthquakes without clipping.
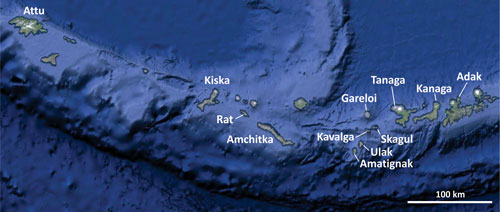
A map of the deployment plan (PDF, last update March 10, 2020) and a detailed deployment plan can be found below. The project is intended to help grow the seismological community, and included opportunities to sail on OBS cruises and short courses for undergraduates. Feel free to contact members of the PI team for more information.
Important note: LDEO OBS station locations incorrect in channel metadata
Prior to late June, 2020, station locations were incorrectly reported in some metadata for LDEO OBS sites (station codes LA##, LD##, and LT##). Specifically, metadata requested from the IRIS DMC at the level of “channel” reported latitude, longitude, and elevation from planning documents, and not from final surveyed OBS locations, while metadata requested at the level of “station” correctly reported final OBS locations. Users should compare station location information for all data downloaded prior to late June, 2020 to correct locations stored in station-level metadata or to correct final locations reported in the table (.txt or .xls) to ensure that correct station locations were used. New metadata were submitted for LDEO OBS sites on June 26, 2020, and were available shortly after this date.
Seismicity Catalog
In an alternative format, the full catalog is available from within the ANSS Comprehensive Earthquake Catalog (ComCat), searching by setting the Catalog option to Aacse
Cruise reports
MGDS is the primary repository for cruise reports. Please find below links to PDF report for each cruise and their MGDS webpage.
- Alaska Amphibious Community Seismic Experiment Leg 1 Deployment | SKQ201811S R/V Sikuliaq
May 9 – 29, | Seward, AK, USA to Seward, AK, USA
More information - Alaska Amphibious Community Seismic Experiment Leg 2 Deployment | SKQ201816S R/V Sikuliaq
July 11 – 25, 2018 | Seward, AK, USA to Seward, AK, USA
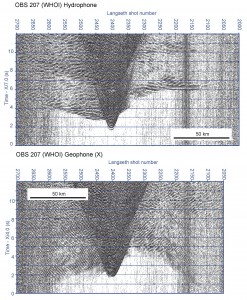
More information - Alaska Amphibious Community Seismic Experiment Active source survey component | MGL1903 R/V Marcus G. Langseth
June 7 – 24, 2019 | Kodiak, AK to Kodiak, AK, USA
More information - Alaska Amphibious Community Seismic Experiment Recovery Leg 1 | SKQ201918S R/V Sikuliaq
August 10 – 29, 2019 | Seward, AK, USA to Kodiak, AK, USA
More information - Alaska Amphibious Community Seismic Experiment Leg 2 Recovery: WHOI OBSs and multibeam surveying | MGL1907 R/V Marcus G. Langseth
August 27, 2019 – September 12, 2019 | Kodiak, AK, USA to Kodiak, AK, USA
More information
Data Availability
OBSIC has released horizontal-component seismometer orientations for AACSE OBSs. That table, along with some clock drift corrections and other reports, are distributed by the IRIS Data Services.
Final station locations based on OBS acoustic surveys or GPS position onshore are available from the IRIS DMC’s Station metadata, or on this table (.txt or .xls).
All broadband seismometer data are now available from the IRIS Data Center under network code XO, and the nodal data are available under network code 8J.
Marine geophysical data are available or being made available through the Marine Geoscience Data System.
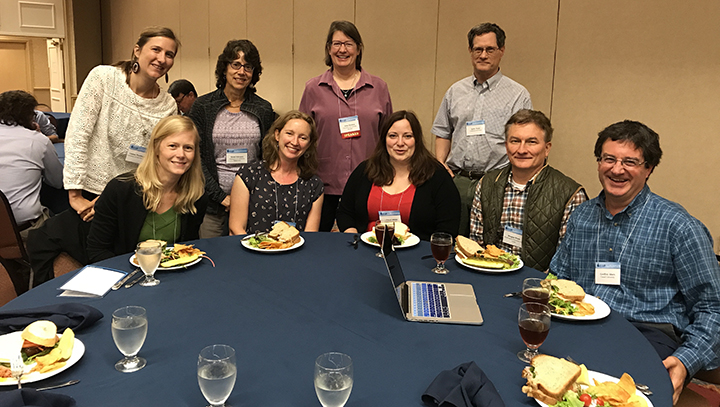
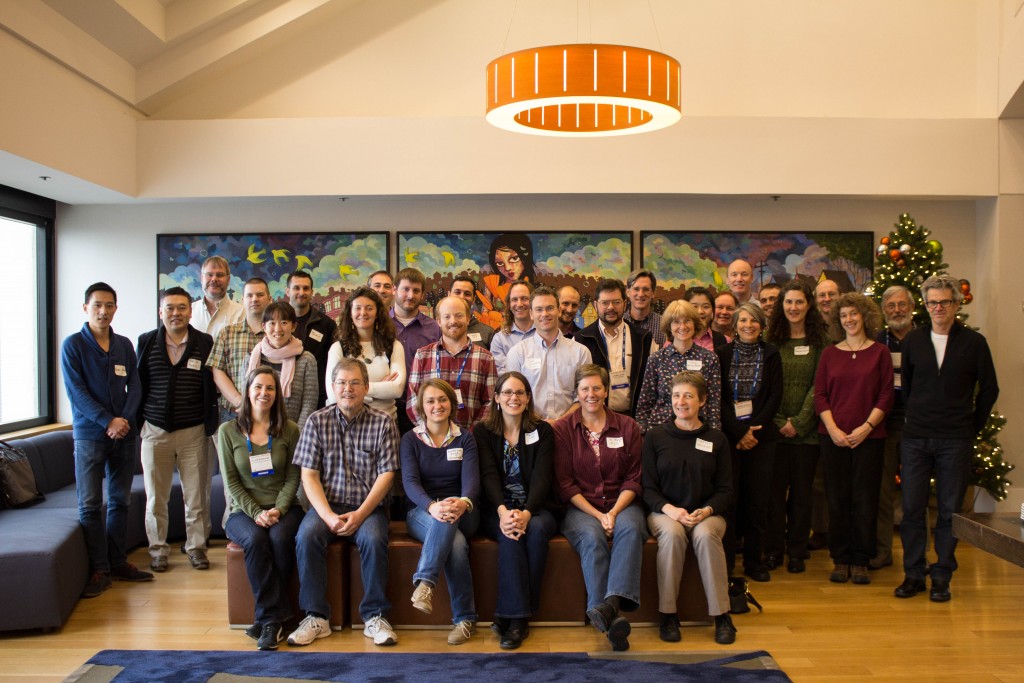
The AACSE PI Team at the Portland (ME) OBS Workshop in September 2017. From left to right, top to bottom: Lindsay Worthington, Susan Schwartz, Anne Sheehan, Spahr Webb, Emily Roland, Donna Shillington, Aubreya Adams, Doug Wiens, and Geoff Abers.
PI team for the Alaska Amphibious Community Experiment
Other project leads
Anne Bécel (LDEO – active-source leg)
Grace Barcheck (Cornell – data assessment)
Natalia Ruppert (UAF – catalog production)
John Collins (WHOI – OBSIC)
Jim Gaherty (LDEO/NAU – OBSIP)
Learn more about the AACSE:
- G. Barcheck, et al., 2020. The Alaska Amphibious Community Seismic Experiment. Seismol. Res. Lett. 91, 6, 3054-3063. doi:10.1785/0220200189
- G. Abers, et al., 2019. Examining Alaska’s Earthquakes on Land and Sea. Eos, 100. doi.org/10.1029/2019EO117621
- The Alaska Amphibious Community Seismic Experiment blog
- GeoPRISMS-Alaska Living Bibliography
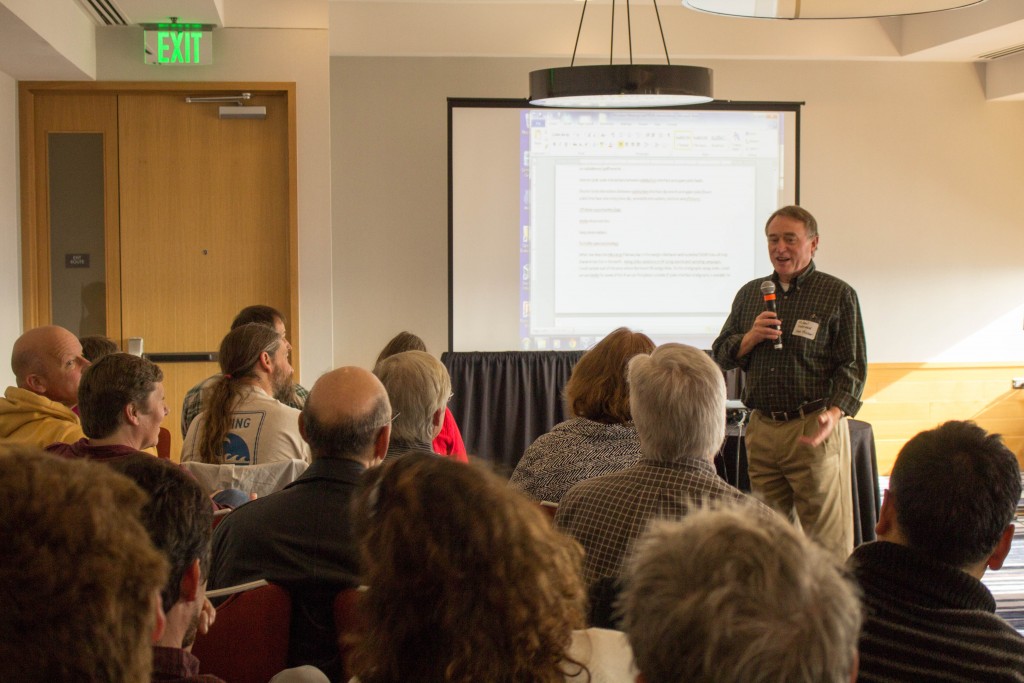
A webinar (April 25, 2016) introduced the community to the exciting scientific opportunities that this DCL offers and to outline general strategies for achieving them. Watch the record of the webinar below.
Presenters: Susan Schwartz, Geoff Abers, Emily Roland, Rob Evans, Doug Wiens, Jeff Freymueller
The AACSE Community
As a community experiment, the AACSE project was intended to build capacity and help grow the seismological community. The project included multiple opportunities for both early and mid- career researchers, students and community members to get involved in the scientific planning and data acquisition. The PI team included scientists at all career stages, including three pre-tenure investigators who were involved in all stages of the project from proposal writing to logistics planning to data preparation and gained experience leading onshore and offshore data acquisition legs.
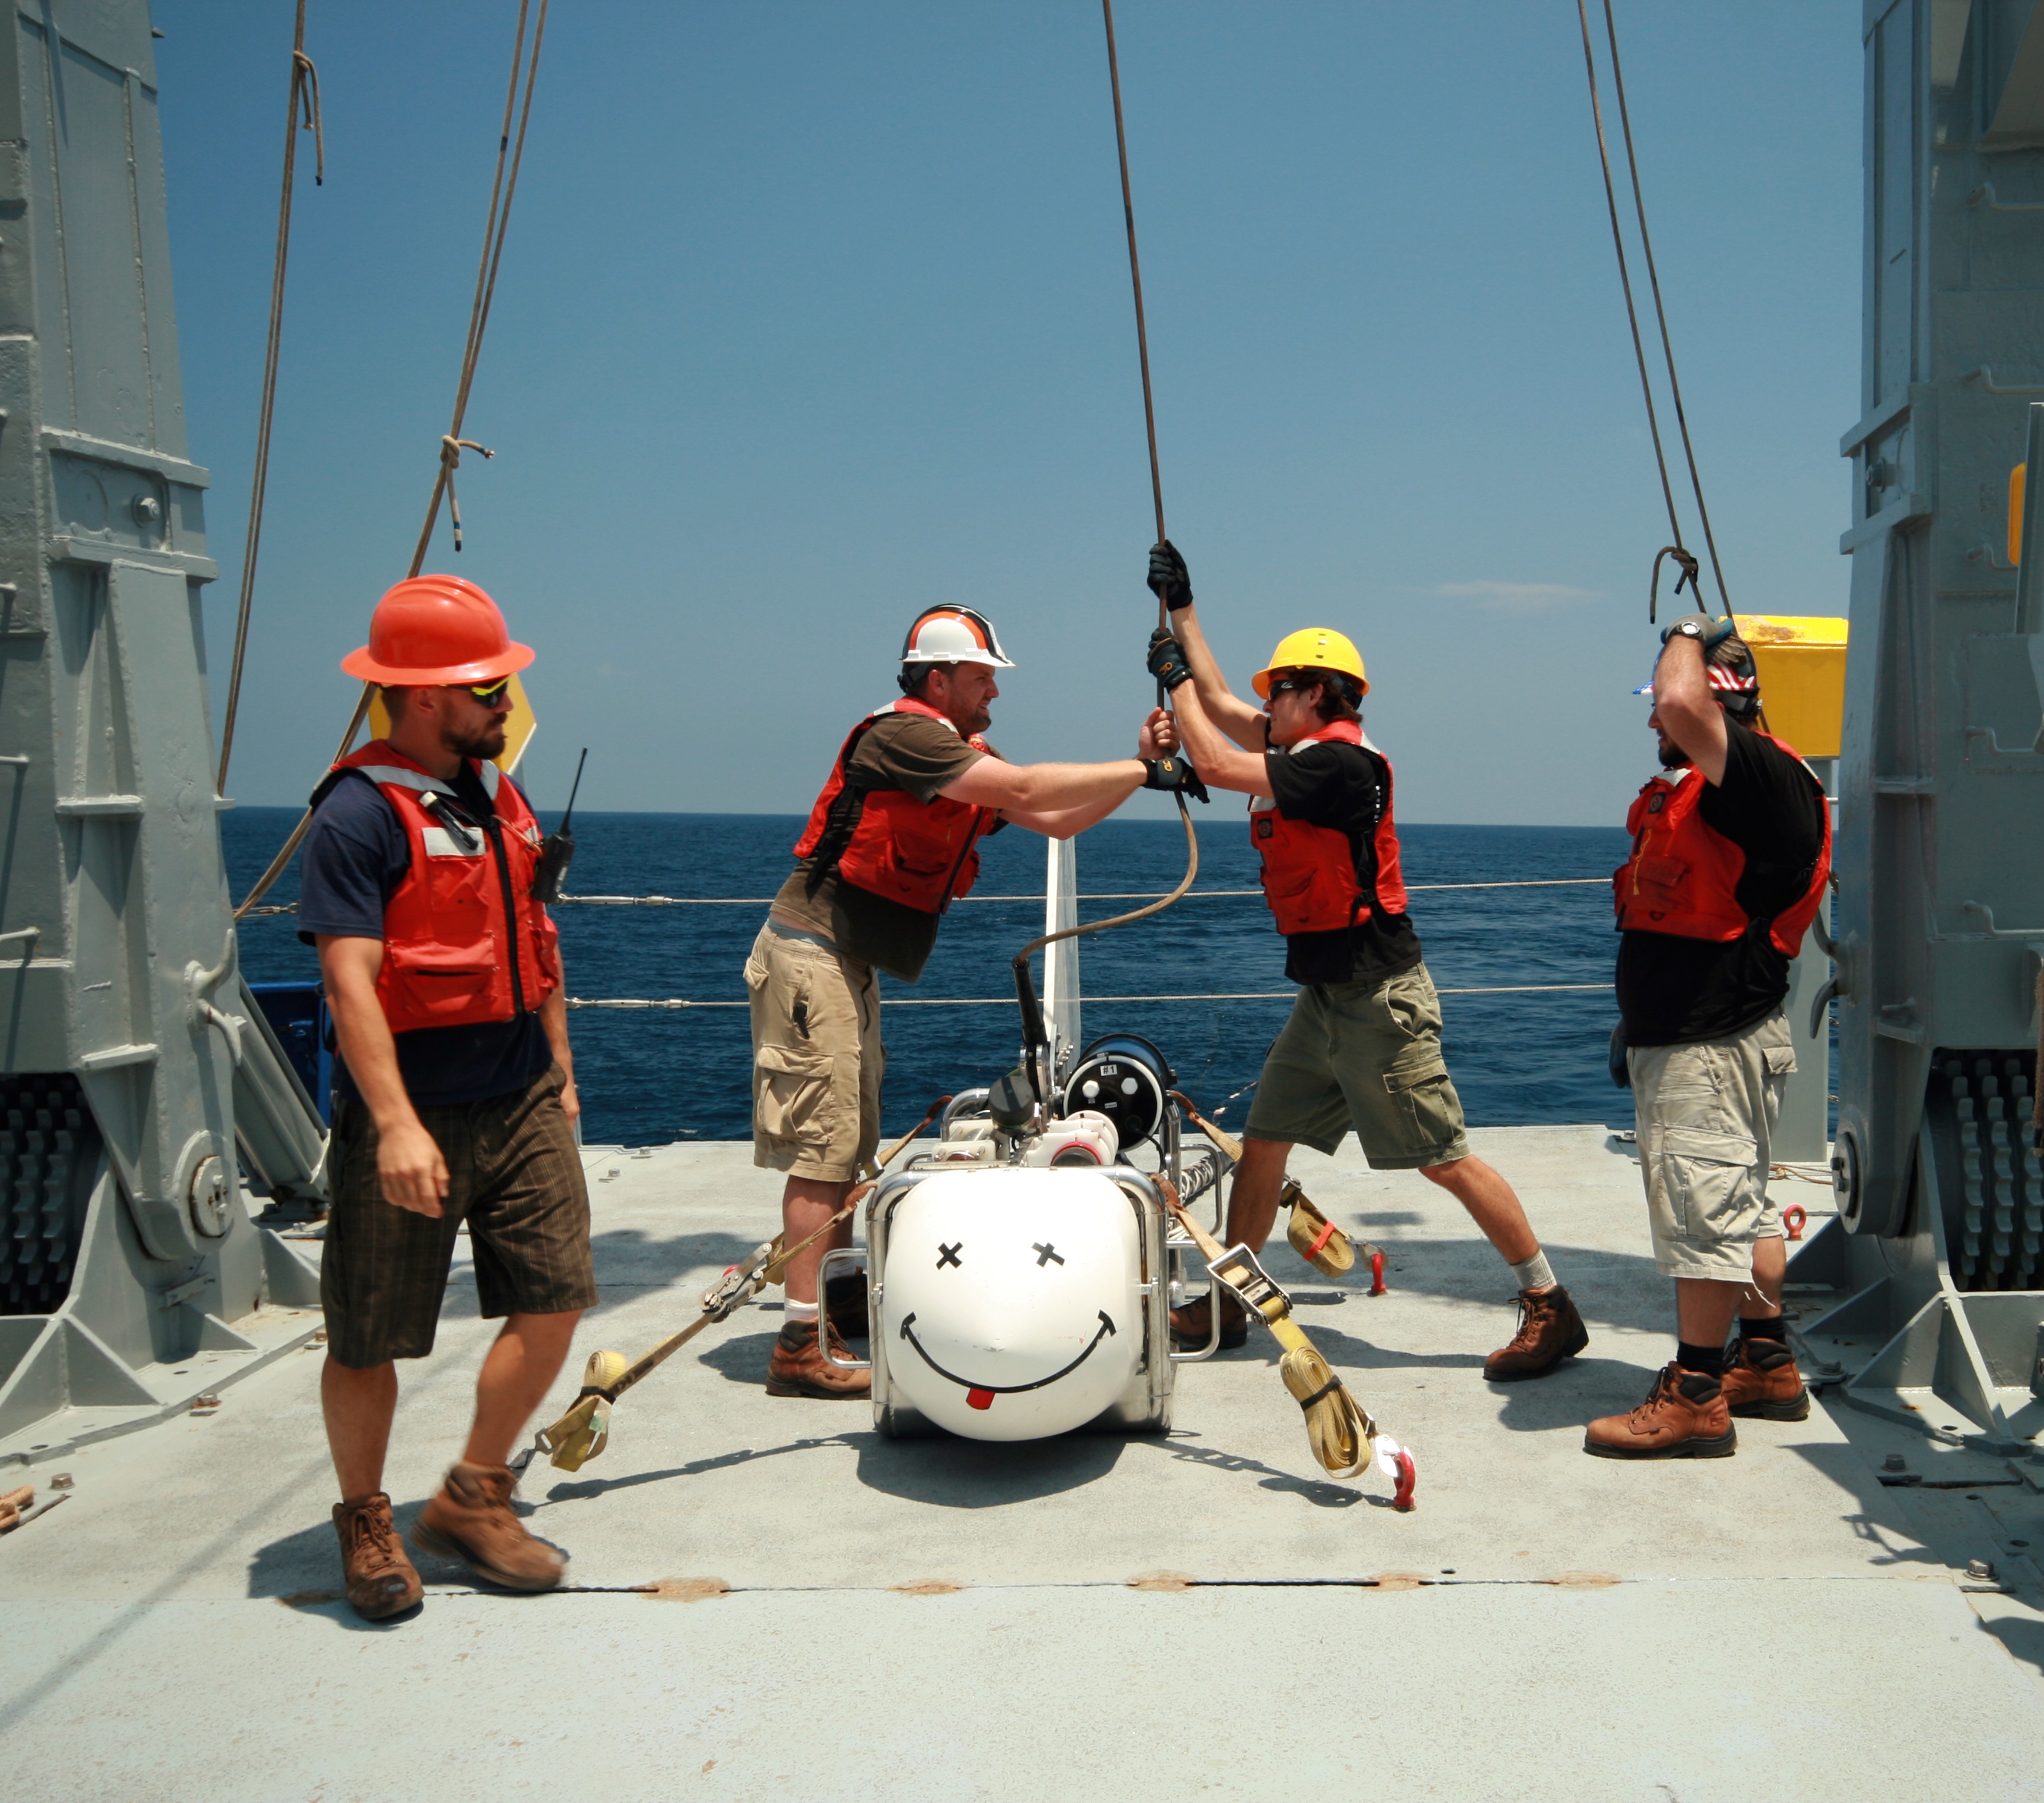
Apply-to-Sail
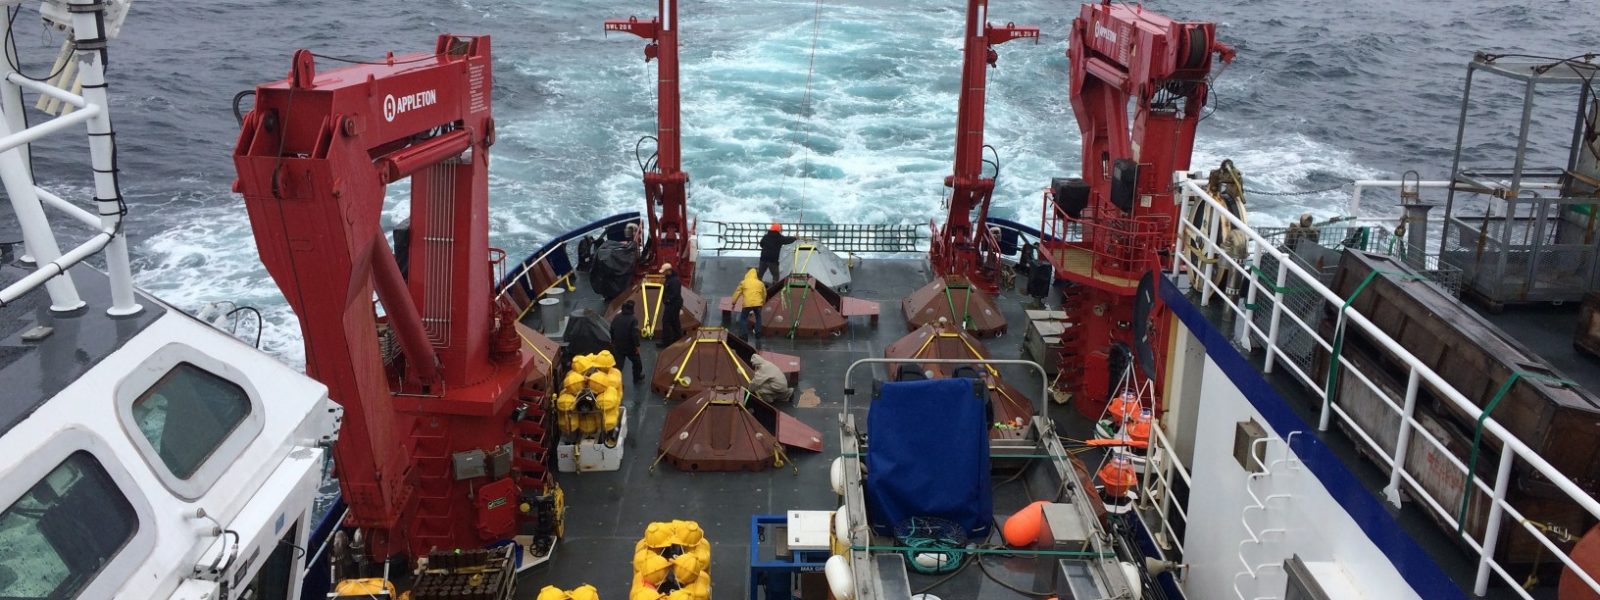
The AACSE Apply-to-Sail program was open to interested scientists at all career stages as a way to broaden and diversify the user-base of ocean bottom seismometer data, offer training in marine geophysical data processing and to develop sea-going experience. Opportunities were advertised via GeoPRISMS and other community listservs, individual PI Twitter handles, and word-of-mouth. Over the course of four offshore OBS operations cruises in 2018-2019 aboard the R/V Sikuliaq and R/V Langseth as well as an active-source acquisition cruise aboard R/V Langseth in 2019, more than 25 Apply-to-Sail participants sailed with the AACSE. These included 20 graduate students and postdoctoral researchers, 3 mid-career scientists new to OBS data acquisition, 3 undergraduate students and two K-12 teachers from Alaska.
“For the past 3 years, I’ve been looking at OBS data off the east coast of New Zealand’s North Island, and I always wondered about the logistics behind ‘my’ dataset of earthquakes. It turns out that deploying ocean bottom seismometers is a huge task that includes multiple people. This experience exceeded all my expectations. I imagined a boring and repetitive process, but every single station has its own challenges: the bathymetry indicating a rough or steep relief so we have to move somewhere close by with a more flat and soft bathymetry, be sure the temperature sensors are the ideal for specific depths, fill the sheets with station information and log it in our physical and digital forms, and a large etcetera. After this experience, I really value all the effort that the science crew did for the deployment and recovery of the data that I am currently working on.”
-Jefferson Yarce, University of Colorado graduate student (now at University of Michigan), Apply-to-Sail 2018 Leg 2
“The Apply to Sail program for the AACSE was my first opportunity to participate in broadband OBS research at sea. As an early career scientist, I believe the experience was formative – it helped develop my understanding of the planning and execution of field operations for OBS experiments, introduced me to the essential roles of technicians and other experts, and allowed me to interact with students from a range of backgrounds as a peer-mentor at sea. I hope to see similar opportunities continue in the future.”
-Helen Janiszewski, University of Hawaii Asst Professor, Apply-to-Sail 2019 Leg 1
Undergraduate Short Course
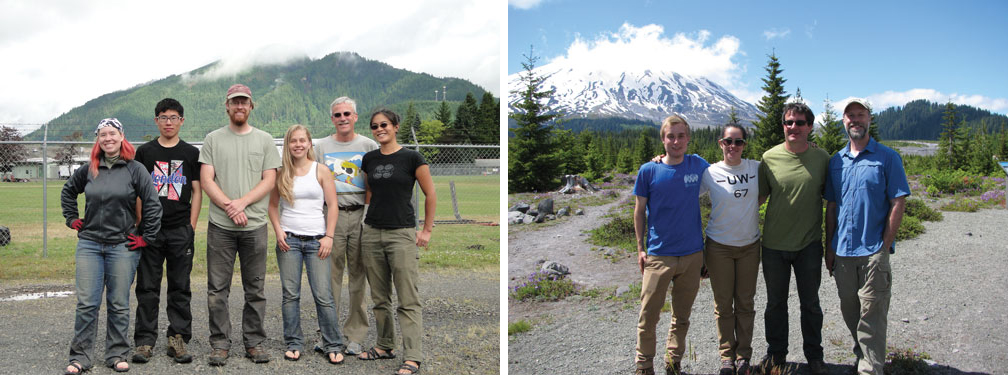
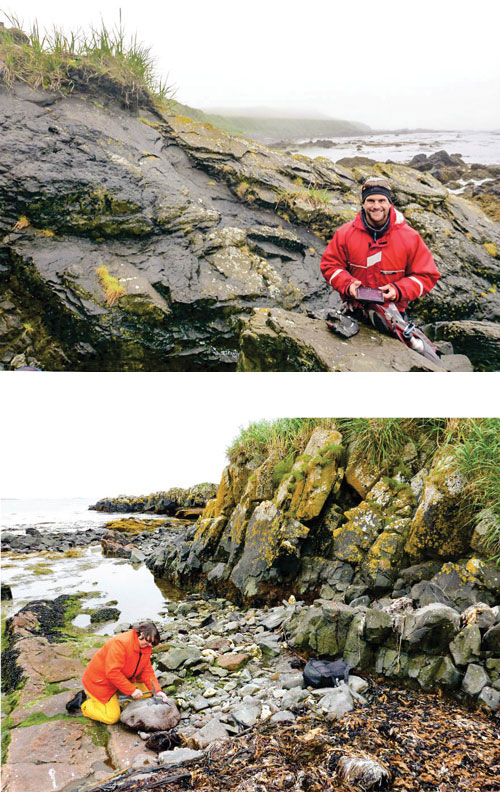
To highlight career and research opportunities in geophysics and tectonics to the next generation of scientists, the AACSE team hosted a short course on seismology and Alaskan tectonics during the summer of 2019. The short course was advertised to a broad range of professional and social platforms, with a strong emphasis on recruiting students from minority serving institutions and institutions lacking a geophysics program. Six students were selected from a national pool of 53 applicants, and joined members of the AACSE team on Kodiak Island. This short course included classroom-based work about how to access and process seismic data, a field trip to important geologic and tectonic sites around Kodiak Island, and field work, during which students assisted with the recovery of 398 nodal seismometers. As a capstone project, the undergraduate student participants created a storymap, outlining the goals of the AACSE, and their own roles within the project (accessible with an ArcGIS account).
I had such an incredible experience with AACSE. I don’t think I realized it at the time, but AACSE really influenced my academic course. I used to study geology region by region or terrane by terrane. AACSE helped me view the world as an interconnected system. It really opened my eyes to the incredible volume of data that some earth scientists work with and different methods of identifying patterns within the data. … [Working in the field] taught me about keeping explicit, easy to understand notes; the importance of checking every serial number; and having a good attitude in the field. I hadn’t even given a thought about grad school until [organizers] asked if I had any plans. -Cora Van Hazinga
Participating in the AACSE project on Kodiak island was an incredible experience. I learned so much about seismology and tectonics from the short course, and it was so valuable to participate in active research and work with the research team to contribute to the project. -Emma Devon