Portland, OR, September 22-24, 2011
1University of Alaska-Fairbanks; 2USGS, Anchorage; 3University of Florida; 4Lamont-Doherty Earth Observatory; 5University of Wisconsin-Madison; 6University of South Carolina
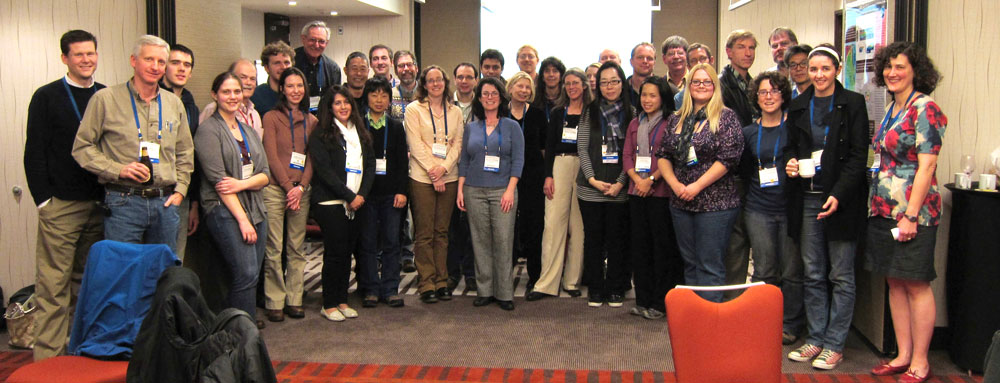
A jointly-sponsored GeoPRISMS-EarthScope Planning Workshop for the GeoPRISMS Alaska Primary Site was held in Portland, OR from September 22-24, with some additional support from the U.S. Geological Survey. There were approximately 140 participants, representing more than 60 U.S. academic institutions, as well as key geoscience stakeholders in Alaska, including the USGS, Alaska Volcano Observatory (AVO), Alaska Earthquake Information Center (AEIC, the regional seismic network), and other potential GeoPRISMS partners. International organizations in Germany, Russia, Japan and Canada were also represented. The group included 22 graduate students and post-docs who took part in a one-day pre-workshop Student Symposium. Lively and substantive discussions took place both in breakout and plenary sessions over the 2.5 day workshop, leading to a clear consensus plan for GeoPRISMS science in Alaska.
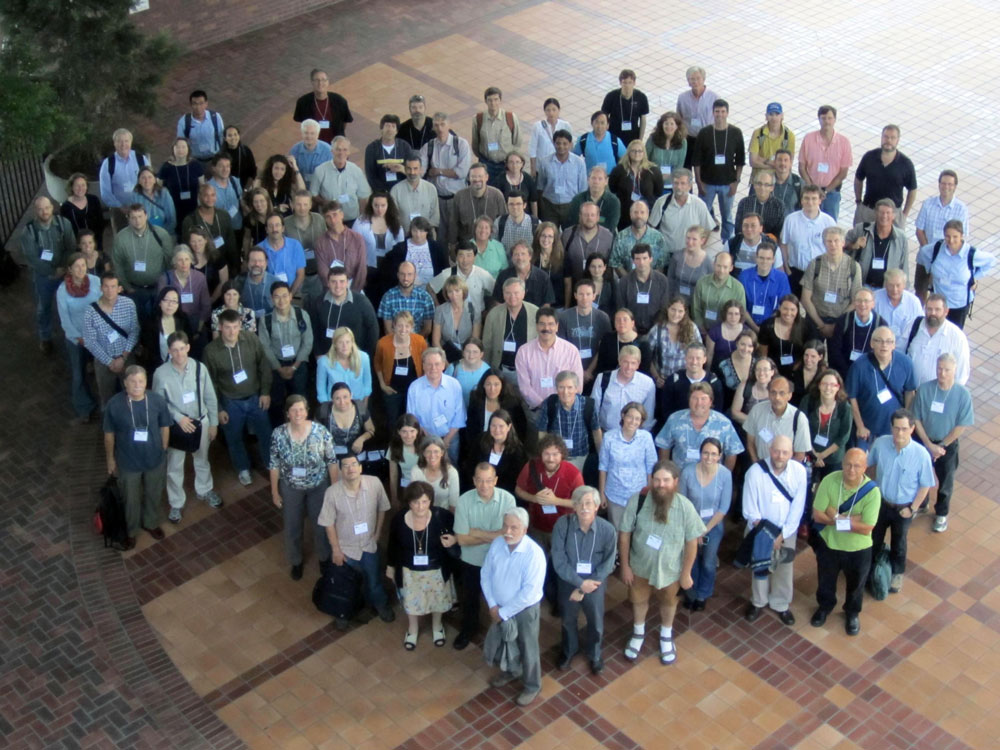
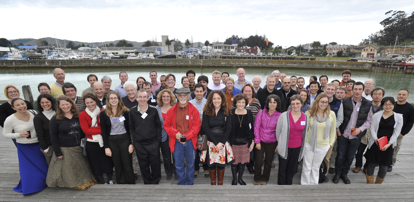
Figure1. GeoPRISMS-EarthScope Alaska Planning Workshop group photo.
Objectives and Process
The objective of the workshop was to solicit community input about research opportunities and priorities that would form the basis for the GeoPRISMS science plan for the Alaska Primary Site. The starting point for the workshop was the Implementation Plan produced during the January 2011 meeting in Bastrop, Texas, where Alaska was identified as the lead primary site for the Subduction Cycles and Deformation (SCD) initiative of GeoPRISMS.
The workshop began with a series of plenary talks that provided an overview and then more focused examination of various aspects of the Alaska-Aleutian subduction system. These talks offered up-to-date summaries of Alaska-Aleutian geology, geophysics and geochemistry, to inform participants and to stimulate participants to think about key opportunities for GeoPRISMS research in the Alaska-Aleutian system. Talks focused on Alaska Margin Tectonics and History (Terry Pavlis and Dave Scholl), Surface Processes and Tectonics (Don Fisher and Sean Gulick), Magma Processes from Deep to Shallow (Peter Kelemen and Stephanie Prejean), and Mantle Processes and Geodynamics (Ikuko Wada and Peter van Keken). Bobby Reece, Rob Harris, Phaedra Upton, Susanne Straub, and Steve Holbrook presented several short talks on subjects proposed in white papers.
Breakout sessions began on the afternoon of the first day of the workshop. The objective of the first breakout was to identify key onshore and offshore research targets and data gaps, and to discuss the concept of “discovery corridors“ as an approach to identifying geographic focus areas within the Alaska-Aleutian system. Participants were encouraged to identify specific locations where GeoPRISMS resources might be most effectively focused on high-impact, shoreline crossing and interdisciplinary research efforts – the hallmarks of the GeoPRISMS program. Participants were encouraged to keep in mind that some important research objectives may be best suited to a thematic research approach, undertaken anywhere in the Alaska-Aleutian system or at any arc on Earth.
Participants were assigned to breakout groups based on their top two research interests chosen prior to the workshop from the SCD key topics. These breakout themes were (1) controls on size, frequency and slip behavior of subduction plate boundaries, (2) spatial and temporal patterns of deformation through the seismic cycle, (3) storage, transfer, and release of volatiles through subduction systems, (4) geochemical products of subduction and creation of continental crust, (5) subduction zone initiation and arc system formation, (6) feedbacks between surface processes and subduction zone dynamics.
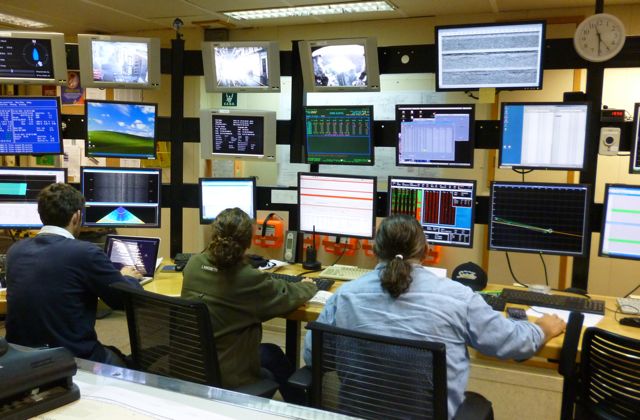
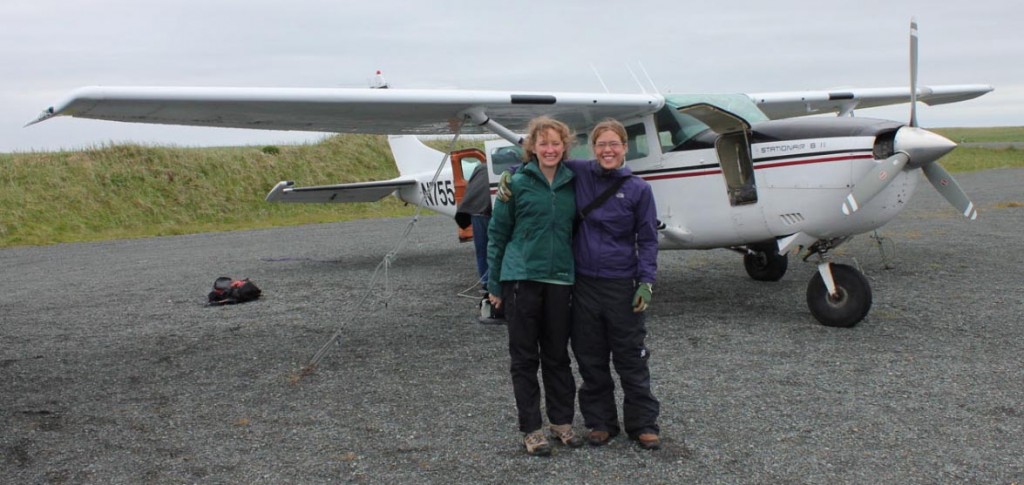
Day one of the workshop ended with a series of short presentations on logistical considerations for fieldwork in Alaska. The major points of emphasis were the challenges of Alaskan weather and long distances, and the importance of long-range planning to allow for permitting along the Alaska-Aleutian margin, which is a patchwork of lands mostly under the control of various public agencies.
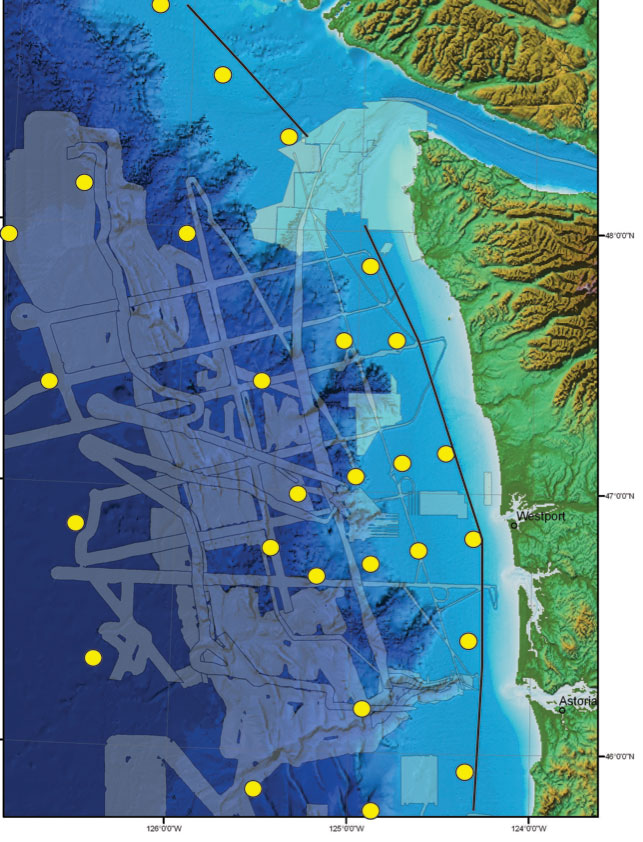
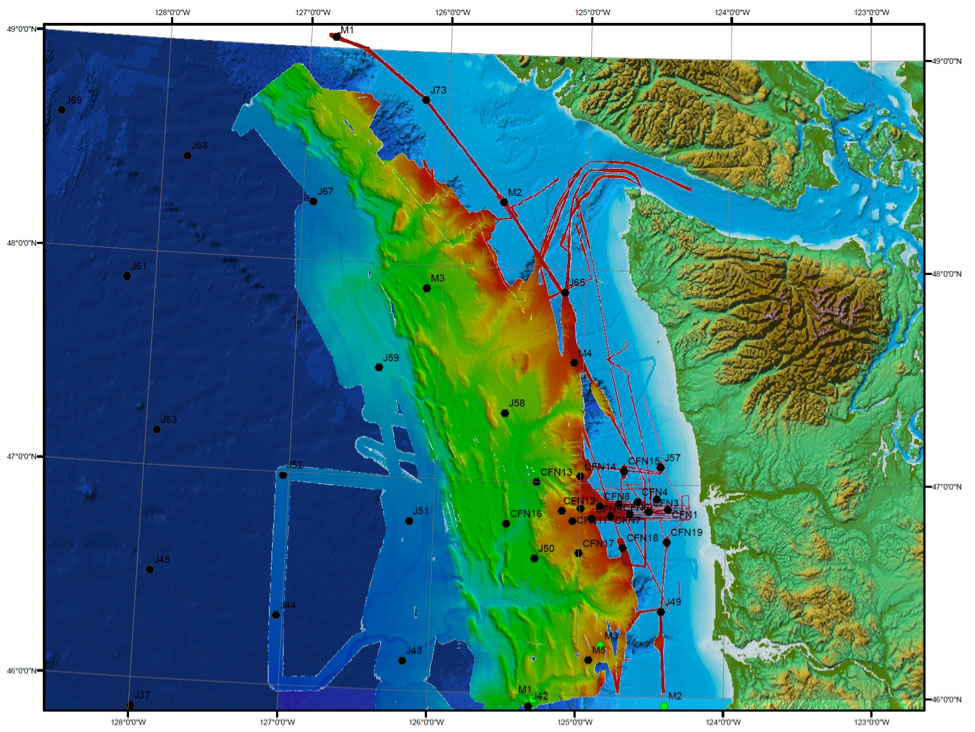
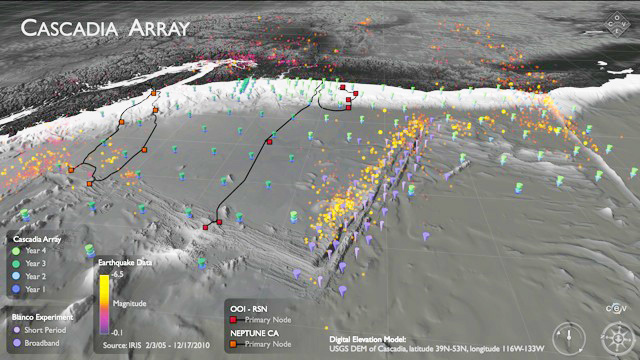
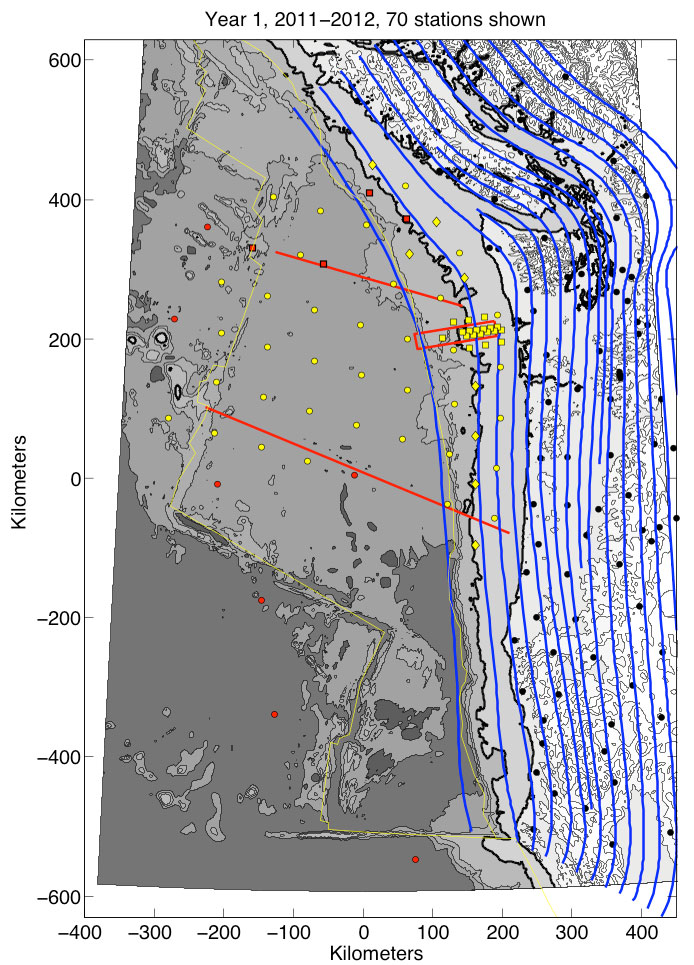
The second day of the workshop began with reports and discussion of the previous day’s breakout sessions. Next was a series of short presentations by a panel of potential GeoPRISMS partners. National organizations represented on this panel were the USGS and AVO (John Power), USGS Volcano Hazards program (John Eichelberger), USGS Extended Continental Shelf Project (Ginger Barth), the Cascadia Initiative (Richard Allen), and IRIS and USArray (Bob Woodward). International panel representation was from the German-Russian KALMAR Project (Christel van den Bogaard), Japan, IODP and JAMSTEC (Yoshiyuki Tatsumi), and Canada (Kelin Wang).
The second breakout session focused on implementation strategies. Participants considered possible “discovery corridor” locations, and identified overlaps and opportunities for synergistic GeoPRISMS and EarthScope activities. Breakout group leaders and participant attendance was the same as on day one to maintain continuity. Reports from breakout session leaders were given immediately after lunch. The third breakout session commenced late in the afternoon on day two. This time participants were mixed with respect to research interest but grouped with respect to their first and second geographic priorities for discovery corridor selection. The geographic sites were Cook Inlet, Alaska Peninsula, eastern Aleutians, Adak-Amlia area and westernmost Aleutians. A sixth breakout group called the Arc Line was also convened to characterize the “back-bone” of the Aleutian (oceanic) part of the Alaska-Aleutian margin, including geophysical imaging and along-strike changes in geophysical, geochemical, and geologic properties and processes.
The second day of the workshop ended after breakout three discussions, allowing the conveners to synthesize the plenary and breakout discussions so far. Their summary reports were presented in the morning of the third day of the workshop, leading into a productive plenary Q&A and discussion, during which broad consensus about GeoPRISMS science implementation in Alaska was reached.
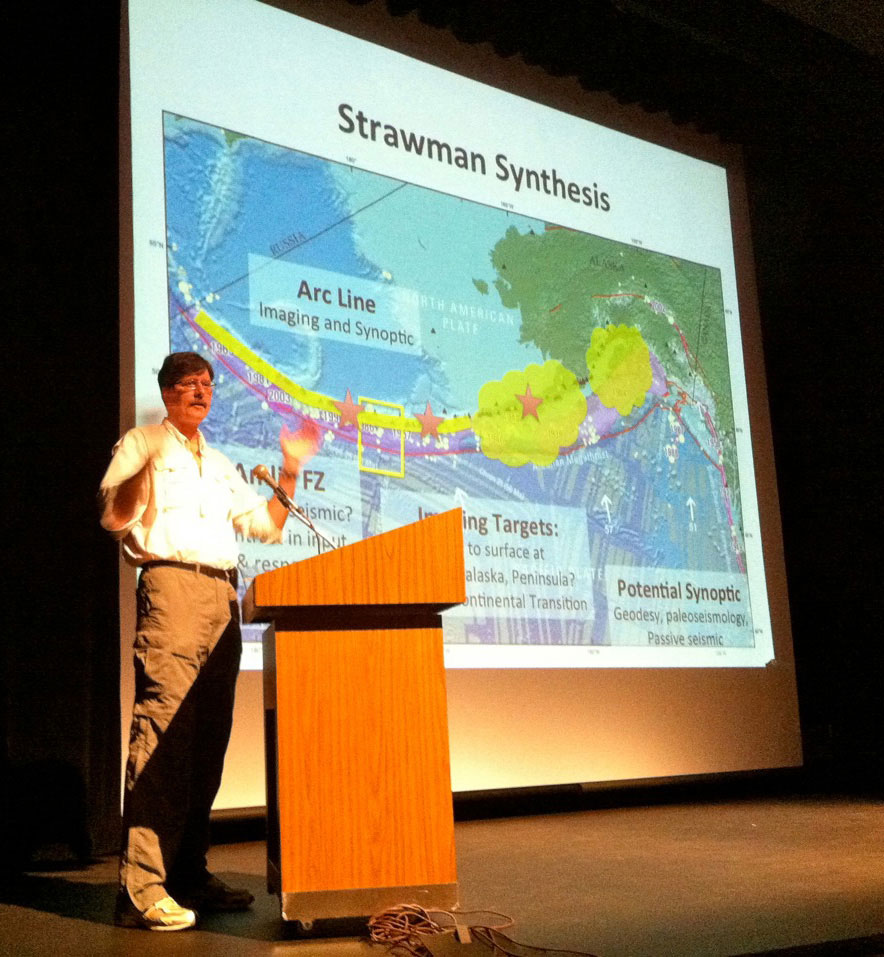
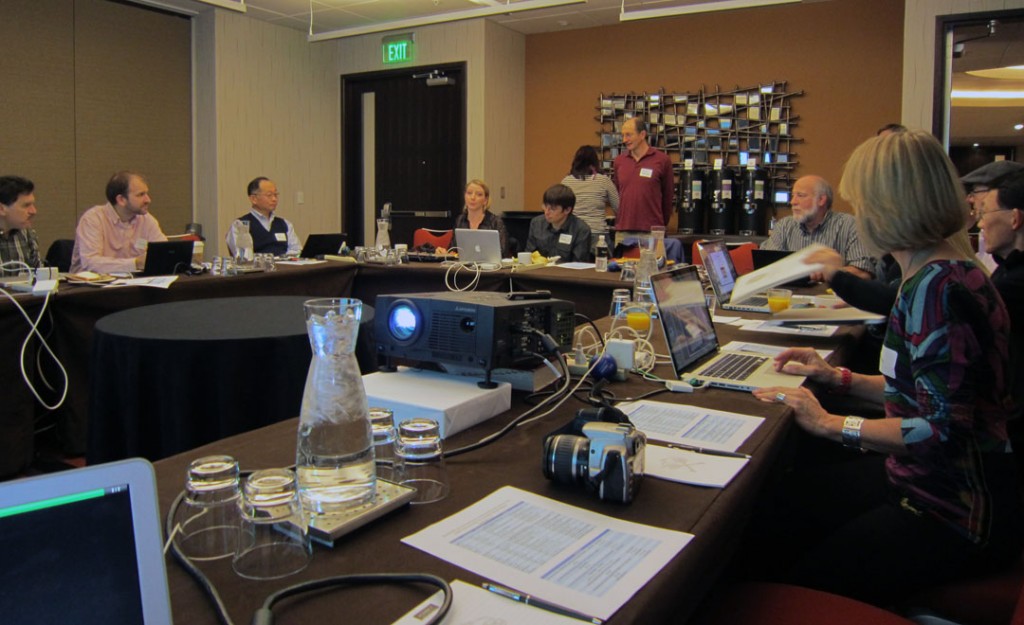
Figure 2. Jeff Freymueller summarizes the outcomes of the Alaska planning workshop break-out discussions.
An Implementation Plan for Alaska
A key objective of breakout three discussions was to establish a prioritization of the six geographic areas under consideration for more focused research, measured here by break-out attendance. The cumulative attendances at each of the geographic areas were: the Alaska Peninsula (55); the Adak-Amlia area (48); Cook Inlet (37); the along-arc transect (32); followed by the eastern Aleutians (25) and the western Aleutians (13). An important outcome of breakout three was the similar scientific and geographic focus of the three groups interested in the Aleutian/oceanic part of the margin. Based on this, the convener group presented a proposed science implementation plan, emphasizing a geophysical transect along the oceanic part of the arc in combination with complementary focused studies of the Alaska Peninsula and Cook Inlet areas.
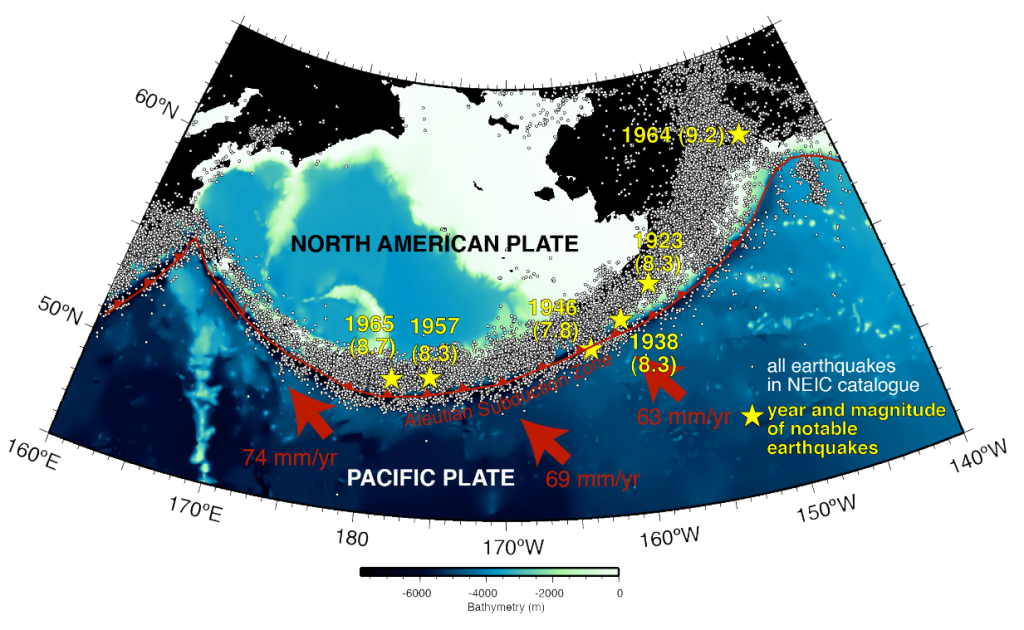
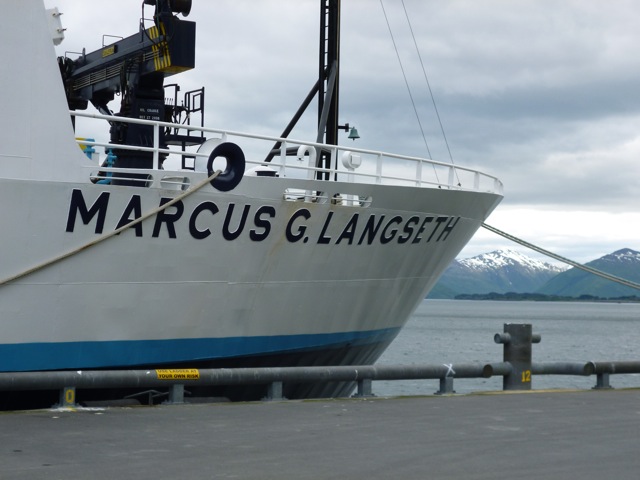
Workshop participants expressed broad support for a large geophysical deployment along the oceanic part of the arc. This geophysical transect is envisioned as the back-bone that provides a framework for focused studies at point locations encompassing varied aspects of the arc, fore-arc, trench and incoming plate. The Aleutian islands provide many advantages for testing ideas about crustal genesis in a subduction setting. The arc has never been rifted, thus the products of ~45 million years of island arc crustal growth are intact and available for study. Additionally, strong contrasts in trench sediment thickness and subducting plate age at the Amlia Fracture Zone area are linked to distinctive magma chemistries in the arc and a change in seismogenic character.
One or more trench/arc-perpendicular transects would intersect the along-arc transect. The highest priority transects are the intersection with the Amlia Fracture zone and focal points in the Adak and Unalaska areas, providing unique opportunities to characterize the birth and evolution of the arc. Volcanoes of the eastern Aleutian area (e.g., Okmok, Akutan, Shishaldin) also provide ideal targets, located on the backbone transect, for slab-to-surface geophysical imaging of the largest and most active volcanic centers in the Alaska-Aleutian subduction system.
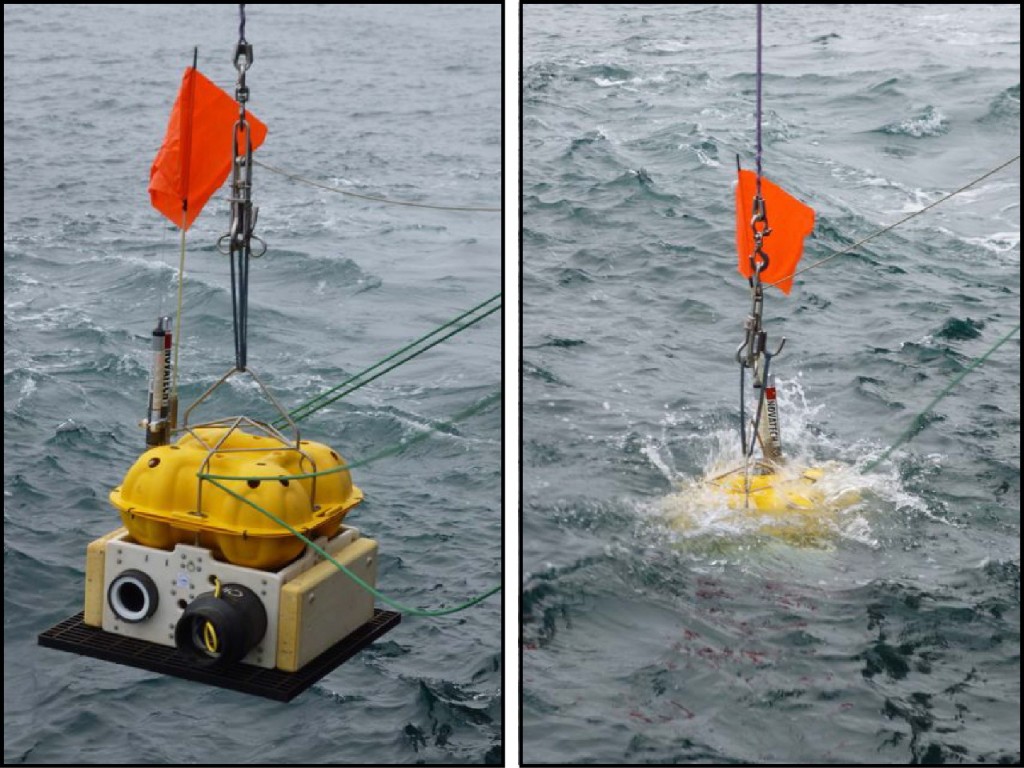
The Alaska Peninsula features dramatic along-strike changes in the seismogenic zone, spanning megathrust rupture areas in different parts of their cycles and with a range of locking behaviors. It is the best location for combining onshore and offshore studies to investigate the causes of these changes. It offers the best opportunity to examine links between seismicity and forearc surface process and variable subduction inputs. This area also includes the most productive volcanoes of the continental part of the arc, with both large dominantly basaltic centers and smaller dominantly andesitic centers, including Katmai, which produced the largest eruption of the 20th century. The group also supported the idea of a future deployment of Cascadia Initiative ocean bottom seismometers in this region.
The Cook Inlet area is the continental end-member of the subduction zone, which experienced a watershed megathrust event in 1964, and is dominated in Quaternary time by glacial and other surface processes that direct sediment into the subduction zone and forearc. This region also shows the clearest evidence in Alaska for large slow-slip events and transient changes in seismogenic zone behavior. This region also features a transition to flat slab subduction due to the buoyant thick crust of the subducted Yakutat terrane, intense microseismicity in the downgoing plate, abrupt variations in shear wave splitting orientations, the SE end of a gap in the volcanic arc, and active faulting and folding of a broad region of the overriding plate.
Both Cook Inlet and the Alaska Peninsula are also areas with substantial opportunities for synergy with EarthScope due to the EarthScope instrumentation that will be in place there, and coordinated research opportunities with AVO (described below), AEIC, and other researchers actively studying processes there.
Alaska was chosen as the highest priority GeoPRISMS Primary Site because of the distinct along-arc changes in volcanism, seismicity, forearc structure, and subducting sediment thickness. Participants recognized that specific synoptic studies were needed that address these spatial changes along the entire arc as opposed to specific target areas. These studies could include geodesy, paleoseismology, surface processes and along-arc sediment transfer, arc geochemistry and geochronology, and passive seismic monitoring.
Impact, Influence and Benefits from Partner Organizations
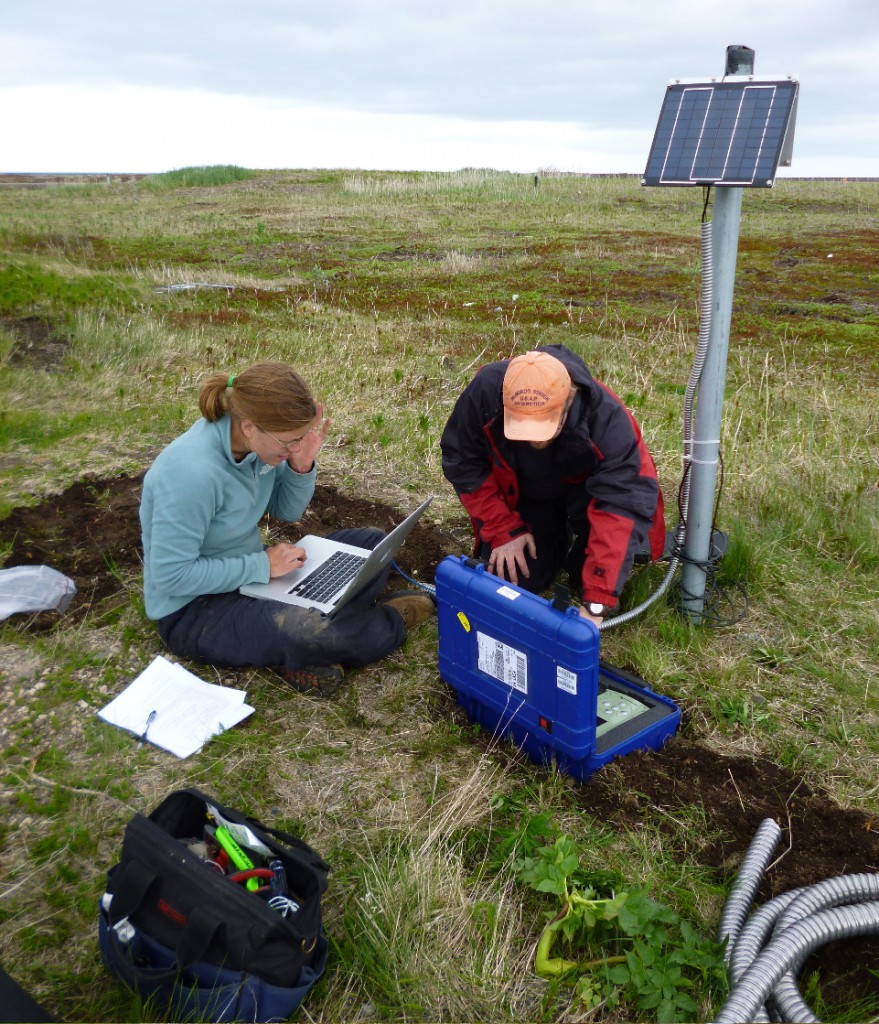
There are clear opportunities for synergy between the GeoPRISMS and EarthScope Programs in Alaska, especially for the Cook Inlet area and also for the Alaska Peninsula. The two programs share many common scientific targets, including the seismogenic zone, fluid cycling, and arc development, The recent report from the May 2011 EarthScope workshop on science opportunities in Alaska discusses many scientific issues and goals that are directly in line with those of GeoPRISMS. EarthScope has supported the installation and operation of ~150 Plate Boundary Observatory (PBO) continuous GPS stations across Alaska, and will support a comprehensive seismic deployment across Alaska in the form of the USArray Transportable Array (TA).
Present and future EarthScope instrumentation in the Cook Inlet area, in particular, offers great opportunities for synergy between the programs on the many shared scientific targets. For example, the TA stations, augmented by EarthScope FlexArray or GeoPRISMS seismic deployments and existing seismic stations on volcanoes, offer the chance for detailed imaging of the mantle wedge and tracking magmas from slab to surface. PBO stations in the area have documented large slow slip events and other transient changes in the behavior of the seismogenic zone, highlighting a great opportunity for research on a topic of great importance for both programs. Other targeted GeoPRISMS investigations would form part of an overall, amphibious, GeoPRISMS and EarthScope research program.
The Alaska Volcano Observatory monitors active volcanoes, assesses the volcanic hazards along the Aleutian arc, and operates seismic networks on 31 of the active volcanoes. John Power, AVO scientist-in-charge, voiced strong support for GeoPRISMS studies. Existing seismic monitoring, geologic mapping, and geodetic monitoring will provide a wealth of background data for focused volcano research. Moreover, AVO is familiar with on-land access and logistical issues in the Aleutians, and they are willing to help provide guidance for involved researchers.
The far western Aleutian area (including the Komandorsky Islands and adjacent Kamchatka Peninsula) is the focus of ongoing work under the German-Russian KALMAR project, which will complement work in GeoPRISMS focus areas further east. Work completed under the first four years of KALMAR focused on several key GeoPRISM themes, including quantifying the volatile flux from active arc volcanoes in the Central Kamchatka Depression, and geochemical and geochronological studies aimed at an improved understanding of the magmatic history and evolution of island arc crust beneath the Komandorsky Islands. KALMAR dredging efforts sampled the incoming plate and fore-arc areas in front of the Komandorsky Islands, and large relict structures in back-arc areas. The prospect for a second four-year phase of the KALMAR project creates a strong international synergy between KALMAR and GeoPRISMS.
Possible international collaboration on the geophysical transect was also discussed, with JAMSTEC indicating strong support.
Broader Impacts
Unquestionably, GeoPRISMS and related studies in Alaska-Aleutian subduction zone have vital societal relevance, in a setting in which geohazards are very visible. The largest US subduction earthquake on record, the M 9.2 1964 Prince William Sound event, ruptured the eastern portion of the subduction megathrust, an area that continues to pose significant seismic hazard for local populations. Tsunamis spawned by large earthquakes and landslides along the Alaska-Aleutian subduction zone can affect the entire Pacific basin. The Aleutian arc is among the most active volcanic regions on the planet, with the potential to disrupt a critical air transport pathway between Asia, North America, and Europe.
The high visibility of geohazards in this setting also offers critical educational and outreach opportunities to GeoPRISMS. Established pathways exist through GeoPRISMS and EarthScope to convey important GeoPRISMS research results in Alaska into college classrooms around the country. Involving nearby schools and communities in instrument deployment and data collection has also proven effective. Efforts to develop a GeoPRISMS REU program would enable new training opportunities for future scientists interested in Alaskan studies. Cooperation with existing statewide programs will provide further outreach as research ramps up in the Alaska Primary Site.
Concluding Thoughts
The conveners thank the meeting attendees for their participation in the process of reaching consensus on the GeoPRISMS science plan for Alaska, and give special thanks to all of the speakers, breakout group leaders, and white paper authors for their contributions in making the workshop such a success. Finally, they want to recognize the enthusiastic participation of the graduate students and post-docs – their input is greatly appreciated.
A number of important tasks lie ahead. The conveners and breakout leaders will prepare a comprehensive workshop report for distribution by November 2011, and an updated draft of the GeoPRISMS Alaska science implementation plan by January 2012. The implementation plan will be made available for public comment prior to final release. It will serve as a guide for proposals submitted for the next NSF GeoPRISMS solicitation, July 1, 2012
GeoPRISMS Newsletter, Issue No. 27, Fall 2011. Retrieved from http://geoprisms.nineplanetsllc.com