Mini-Workshop Report | From rifting to drifting: evidence from rifts and margins worldwide


AGU Fall Meeting 2015, San Francisco, USA

Conveners: Rebecca Bendick1, Ian Bastow2, Tyrone Rooney3, Harm van Avendonk4, Jolante van Wijk5

1University of Montana, 2Imperial College London, 3Michigan State University, 4Univ. Texas Institute for Geophysics, UT-Austin, 5New Mexico Tech

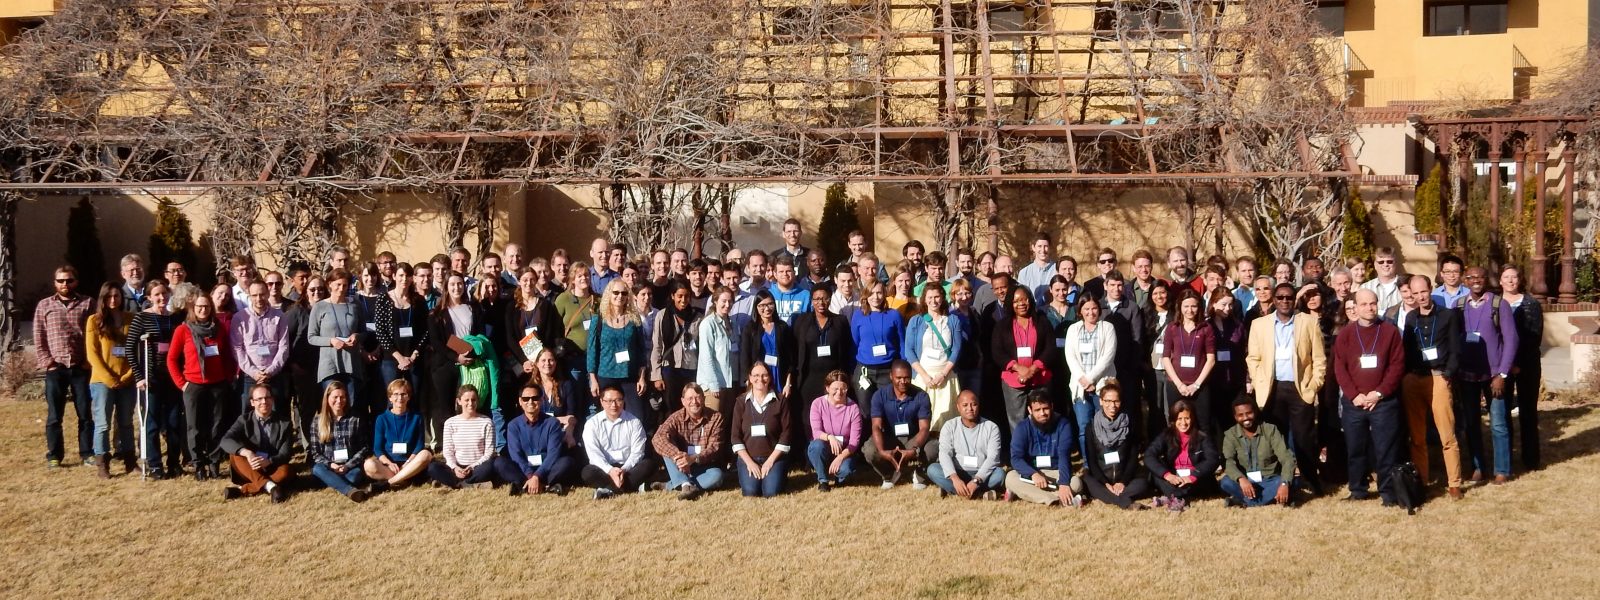
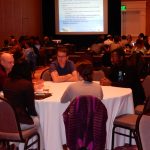
On Sunday December 13, 2015, from 8am to 1:30pm, a representative cross section of researchers interested in rifting met in the Grand Hyatt San Francisco before the AGU Fall Meeting. Our primary focus was to facilitate discussion on the current state of research into continental extension. Our aim was to be broadly inclusive by bringing an audience with widely varying backgrounds to a common understanding of the state of the art in this field. Our ultimate goal was to initiate a discussion on future research challenges for the community and how these challenges align with the existing science plans for the GeoPRISMS Eastern North America and East African Rift Focus Sites. To facilitate community building and cross disciplinary linkages, the meeting was coordinated with the STEPPE consortium (Sedimentary Geology, Time, Environment, Paleontology, Paleoclimatology, Energy) workshop investigating source-to-sink processes of the Lake Tanganyika rift (East Africa), which took place directly following the GeoPRISMS workshop from 2 to 8pm.

The meeting was structured to allow for discussion under four broad subheadings:

Topic 1: Melt Generation in Extensional Environments

A 30 minute introduction to this topic was presented by Tyrone Rooney. The talk covered the historical context of rifting studies and then focused on the relationship between magma and lithospheric strength. The concept of magma within the lithosphere facilitating rifting was introduced. The presentation examined how magmas provide an important temporal record of mantle processes during extension. It was shown how thermochemical constraints of the upper mantle source region of rift magmas could be probed with erupted lavas. In particular, the dual challenges of mantle potential temperature and pyroxenites in the upper mantle were highlighted as important frontiers in our understanding of mantle melting processes. The role of volatiles in some rifting environments (Rio Grande Rift) was introduced. The role of magmas in influencing seismic images of the upper mantle and also acting as a mechanism of strain accommodation during late stage rifting was also discussed. Finally, an examination of the continental lithospheric mantle as a possible magma source was also presented.
The discussion, moderated by Harm van Avendonk, first explored the issue of the role of water in magma generation processes. In particular, there were questions asked about the storage of water in water-bearing phases but also the ability of olivine to store volatiles. Further discussions continued on the role of hydrous phases on lithospheric rheology. The first key question arising from these discussion was – where could volatiles reside and how much in the source of rift magmas (especially water and carbon dioxide). Suggestions on approaching this question through studies of xenoliths and reconstructing lithospheric architecture were made. The second key question focused on the role of structural inheritance. It was acknowledged that crustal heterogeneity and mantle lithosphere heterogeneity may not necessarily correspond. Finally the third key question related to the amount of melt generation with the timing and magnitude of stretching.

From rifting to drifting: evidence from rifts and margins worldwide | December 13 AGU 2015

Topic 2: Magma-lithosphere interaction

A 30 minute introduction to this topic was presented by Chris Havlin. This presentation first delivered an overview of the physics and thermodynamics of melt transport. This was further subdivided on the basis of porous flow within the mantle and lithosphere and in terms of crustal fractures and channels and how lithospheric inheritance influenced melt transport. The porous flow concept was expanded to examine the dependence on pressure gradients, buoyancy and dynamic pressure. The concept of a ‘freezing boundary’ was raised in terms of a melt focusing mechanism, which if dipping, could redistribute melt. Within the lithosphere the concept of lithospheric and crustal fabrics was raised. It was acknowledged that grain size may affect porosity and surface tension. As a result, melt is preferentially directed into smaller grain size domains. The presentation also examined end-member models of strain i.e. whole lithospheric heating, and basal heating and impact of the porosity front shallowing over time creating an effective thinning of the lithosphere. Finally, it was shown that there could be a growing zone of modified lithosphere whereby mechanically it behaves as does the asthenosphere but chemically it may still resemble the lithospheric mantle.
The discussion, moderated by Ian Bastow, first examined the concept of the background state of stress in rifting environments and how stress may change with changes in viscosity. It was noted that thinning does not require large extensional stresses. A point was raised on the competing grain size effects on porosity and surface area in relation to bulk permeability. Questions were raised by the group as what happens in relation to thinning and melt alteration of the lithosphere in seemingly amagmatic rift segments. It was acknowledged, however, that segments defined as amagmatic due to a lack of surface volcanism may still possess significant melt at depth within the lithosphere. As a result of these discussions, two key questions arose: (1) What is the role of melt in magmatic and amagmatic (in terms of surface volcanism) rift segments? and (2) What are the feedbacks between melt transport and lithospheric thinning and what are the mechanisms?

Topic 3: Stretching the lithosphere

A 30+ minute introduction to this topic was presented by Suzon Jammes. The presentation first examined the concept of mechanical stretching and the genetic relationship of stretching as an important factor in the Wilson Cycle. The factors controlling this mechanical stretching focused on exhumation, tectonic inheritance, and the control of rift and margin architecture. The topic of depth-dependant stretching was examined and how vertical decoupling was incompatible with pure and simple shear endmembers. An introduction to time-dependant stretching mechanisms followed with some idealized cross section of basinward migration of deformation. Dr. Jammes presented an evolutionary model whereby mechanical stretching was followed by the creation of a ‘necking zone’ for major crustal thinning and finally an exhumation phase. The discussion continued into a discussion of how rifting processes are determined by rheological layering of the lithosphere and the impact of structural inheritance and sensitivity to this vertical layering.

The discussion, moderated by Rebecca Bendick, was more limited due to time constraints but did establish a key question of how the feedbacks with melting might vary in terms of the recognized global variety of architectures of rifts and rifted margins.

Topic 4: Melt delivery and focusing

A 30 minute introduction to this topic was presented by Derek Keir. Dr. Keir showed how within the East African Rift changes in mantle potential temperature are probable first order controls on magma supply. It was also shown how variations in magmatism are multi-scalar with lateral variation at several scales both in the presence and absence of melt and melt chemistry. There was a view that melt pathways and focusing might represent the best mechanism for generating smaller scale variability and examples from the Black Sea and Afar were shown. Afar provided a particularly interesting case as in this region it was show that volcanism responded to increasing subsidence. That is, the more the thinning, the more melt and thus more melt focusing. Dr. Keir showed how a mantle potential temperature anomaly of at least 100 degrees could help explain observed seismic velocities and also the presence of melt throughout the region. A comparison was made between Afar and slow spreading ridges and also to Krafla (Iceland) between 1975 and 1984. The discussion continued as to the impact of melt focusing in time and space and how it is influenced by the temporal accumulations of tectonic stresses. The result of this was described as a general migration of volcanism from the rift flanks towards the rift axis with the competing tectonic and gravitational stresses.

The discussion, moderated by Jolante van Wijk, examined comparisons between the Havlin models discussed in topic 2 and those presented by Keir in topic 4. Some discussion centered on the concept of focusing at the lithosphere-asthenosphere boundary and then subsequent defocusing within the crust. It was acknowledged that geochemical data were critical to address these issues. It was noted that magmatic sources clearly differ along strike within the rift and thus are inconsistent with a single centralized source.

From rifting to drifting: evidence from rifts and margins worldwide | December 13 AGU 2015

Broad discussion

Following a break, the group reconvened to try and systematize some of the key concepts raised. The issues can be summarized as follows:

1. Rift Initiation
What is the role of mantle plumes?
How can mechanical heterogeneity facilitate initial rifting?
What role does chemical heterogeneity in the lithospheric mantle control initial extension?
What is the initial thermo-chemical structure of the lithosphere and asthenosphere in a nascent rift?
What does incipient rifting look like? Okavango suggests preexisting structure critical.
Is this a top down or bottom up process? How does extension propagate?

2. Evolution of rifting in time and space
Why do rifts ultimately fail?
What is the role of nonlinear feedbacks?
How can datasets from igneous petrology and the sedimentary record provide a temporal insight into rift evolution?
What is the time evolution of strain?

3. Rift Architecture
How do non-uniqueness issues create difficulties in creating global models of rift evolution?
How can real constrains be linked with ever more innovative and detailed simulations?
What variables control the strength of the lithosphere?
What is the role of far-field vs. local controls on strain and rift evolution?

4. Volatiles in extensional environments
What are the volatile pathways from depth to the surface?
How deep are the volatiles derived from?
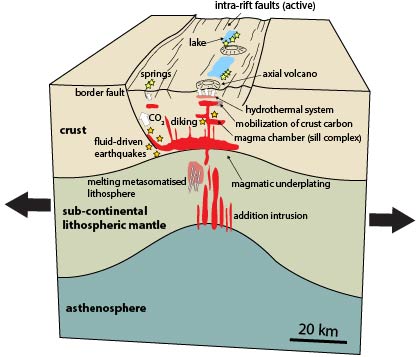
What is the role of rift valley volcanoes in global production of volatiles (e.g., CO2, SO2)?
How can lithospheric heterogeneity and inheritance influence the volatile budget?

In summary the basic concepts on which the group agreed that were critical for GeoPRISMS were:

  1. What is the history of melt? Where is it formed, when is it formed, why is it formed, how is it focused, and what pathways does it take through the lithosphere?
  2. What is the material (thermal and chemical) heterogeneity in the rift lithosphere? How does inheritance play a role, is there spatial organization at play, and how can we assess the importance of these heterogeneities to rifting?
  3. Comparison of focus areas is needed. How do ENAM and the EAR differ and how are they similar? What can be learned from focused studies at both sites?

Go to the Mini-Workshop webpage

Reference information

From rifting to drifting: evidence from rifts and margins worldwide, R. Bendick, I. Bastow, T. Rooney, H. Van Avendonk, J. van Wijk

GeoPRISMS Newsletter, Issue No. 36, Spring 2016. Retrieved from http://geoprisms.nineplanetsllc.com

Workshop Report | NSF-GeoPRISMS Rift Initiation and Evolution Theoretical and Experimental Institute


Tobias Fischer1, Donna Shillington2
1University of New Mexico, 2LDEO, Columbia University

The GeoPRISMS Theoretical and Experimental Institute (TEI) for the Rift Initiation and Evolution (RIE) initiative was held February 8-10, 2017 in Albuquerque, NM. This meeting brought together 132 scientists with diverse expertise working on rifts and rifted margins around the world to discuss recent scientific advances, emerging questions, and to identify potential high-priority science for future GeoPRISMS RIE efforts. The meeting included a series of oral and poster presentations, pop ups and discussions. The workshop conveners have prepared a report that summarizes science results and future directions discussed at the workshop.

The GeoPRISMS Rift Initiation and Evolution (RIE) Theoretical and Experiment Institute (TEI) was held in Albuquerque, NM from February 7-10. The objectives of the meeting were to summarize progress and recent scientific advances related to the RIE initiative, identify high-priority science for future GeoPRISMS RIE efforts and promote community building and formation of new collaborations.

To meet those objectives, a diverse group of scientists was enlisted to serve on the convening team, give invited and contributed talks and to contribute to the meeting as attendees. The expertise of conveners, speakers and attendees spanned a broad range of interests connected with the RIE initiative, from deep geodynamical processes underlying rifting to surface processes controlling syn- and post-rift evolution. Scientists undertaking studies in the RIE primary sites (the East Africa Rift and the Eastern North American Margin) and working at other rifts and rifted margins were encouraged to contribute to all aspects of the workshop to ensure diverse perspectives. The meeting was attended by 133 participants, 59 of which were students and postdoctoral researchers. Besides attracting a large group of early career scientists, attendees included mid-career investigators who were relatively new to RIE science. Scientists from abroad were invited to attend to provide insights regarding the RIE primary sites and on rifts in general.

The meeting structure was designed to cover the broad spectrum of science included in the GeoPRISMS RIE science plan, to encourage interdisciplinarity and to bring in diverse perspectives. The main meeting had seven main oral sessions:

  1. Rift evolution from initiation to post rift architecture
  2. Geodynamics of rift and post-rift processes
  3. Magmatism and volatile exchanges
  4. Faulting and strain
  5. Surface processes & feedbacks between deep/surface processes
  6. Hazards associated with rifting environments

There was substantial time allocated for discussion and interaction; the meeting included several poster sessions at various times of day, two breakout sessions, one small-group discussion and plenary discussion after each oral session and throughout the meeting. As described in more detail below, the speakers successfully synthesized the state of knowledge on various aspects of rift evolution and of highlighting important outstanding questions. The breakouts and discussion were dynamic, generating excellent ideas and insights. The main meeting was preceded by a half-day student and postdoc symposium organized and led by three postdocs.

Overview of science presented at the meeting

Student-Postdoc Symposium

The student-postdoc symposium was held the afternoon before the main meeting and was led by Yelebe Birhanu (Bristol), James Muirhead (Syracuse), and Jean-Arthur Olive (LDEO). The organizers began the symposium with a presentation that provided an overview of the outstanding science questions related to RIE. These questions focused on the topics of rift initiation, the 4-D rift architecture, long- and short-term rift deformation mechanisms, rift volcanism, magmatism and volatile fluxes as well as surface processes at rifts and rifted margins. These topics were the focus of small group discussions later in the afternoon, and the discussion leaders summarized these discussions during the first day of the main meeting to all attendees. The symposium also included pop-ups by all participants on their RIE related research. Over sixty people attended the student-postdoc symposium, including nearly all students and postdocs at the meeting and a few representatives from the GeoPRISMS Office and GSOC, NSF and the convening team of the main meeting. The scientific discussions were followed by a career development panel discussion where students and postdocs had the opportunity to engage directly with scientists at a variety of stages in their careers.

Main meeting

The main part of the meeting began with a session on rift evolution from initiation to post-rift architecture. Roger Buck (LDEO) emphasized the role of magma throughout the life of rifts, from diking during rift initiation to the association of rifted margins with large magmatic outpourings and seaward dipping reflectors. Harm Van Avendonk (UTIG) reviewed insights on rifting processes from studies of both magma-poor and magmatic rifted margins, where recent studies show interesting variations in the distribution and timing of magmatism in relation with rifting, including provocative clues from ENAM on distribution of magmatism and highly thinned continental crust. Danny Brothers (USGS) focused on postrift evolution of rifted margins, including how sediment delivery and pre-failure configuration control evolution and evidence for active fluid venting, slope failure, and sediment compaction.

Session 2 focused on geodynamics. Jolante Van Wijk (NM Tech) provided an overview of numerical modeling approaches and the importance of testing and comparing models to both observations and other numerical solutions. Zach Eilon (Brown) synthesized geophysical observations from the Woodlark Rift in Papua New Guinea and showed evidence of limited melt, lithospheric removal and opening direction parallel anisotropy. Andrew Smythe (Penn State) showed how high-temperature thermochronology and diffusion speedometers can be used to assess mantle upwelling rates and how strain is vertically distributed during rifting. Robert Harris (Oregon State) showed high-resolution heat flow results from the Gulf of California and emphasized the role of fluid flow as well as conductive heat transfer. Colton Lynner (Arizona) showed new shear-wave splitting results from the ENAM community seismic experiment and suggests that 3-D edge driven flow at the edge of the margin can explain their observations.

Session 3 followed with talks on magmatism, volcanism and volatile exchanges. Cornelia Class (LDEO) gave an overview of the geochemical and petrological tools to identify magma and volatile sources in rift settings, highlighting the importance of using multiple geochemical systems to identify mantle components. Sara Mana (Salem State) showed chronological and geochemical data from the North Tanzania Convergence zone and highlighted the evidence for pulsed magmatism and a metasomatized mantle source. Juliane Hübert (Edinburgh) provided new insights on magma storage and pathways using magnetotelluric data in the Main Ethiopian Rift. Madison Meyers (U. of Oregon) emphasized the occurrence of large silicic volcanic centers in rift settings and showed how detailed work on volatiles recorded by melt inclusions allow for the quantification of magma ascent rates. Philip Kyle (NM Tech) ended the session with an overview of the magmatic history of the West Antarctic Rift.

Day 2 started off with the session on faulting and strain, where Cindy Ebinger (Tulane) provided a ‘recipe for rifting’ for cratonic and orogenic rifts where the difference in both crustal and mantle rheology are of critical importance for rift architecture and extension, including the possibly important but poorly known hydration state and distribution of volatiles at depth. Paul Umhoefer (Northern Arizona U.) showed how variations in inherited structures, strain partitioning, angle of obliquity and sediment input control extension in the Gulf of California – Salton trough plate boundary.

James Muirhead (Syracuse) showed the results from an interdisciplinary study in the East African Rift that better constrain the role and sources of fluids and mantle melting in the early stages of rifting and their connection to faulting. Hannah Mark (WHOI) provided new insights from modeling of observed seismic coupling coefficients that show how the thermal regime scales with seismic coupling in MOR and continental rifts. Elifuraha Saria (Ardhi) ended the session by providing an overview of geodetic constraints on crustal deformation in Africa emphasizing the fact that large parts of the continent are not adequately monitored geodetically.
Session 5 focused on surface processes and feedbacks in rifts, where Kyle Straub (Tulane) showed how geomorphology signals are stored in the stratigraphic and landscape record. His talk was followed by Jean-Arthur Olive (LDEO) who discussed the role of surface processes in the stabilization of half-graben structures. Erin DiMaggio (Penn State) talked about the connection between rift development as preserved in the stratigraphic record and the development of the Ledi-Geraru paleontological site. Liang Han (Virginia Tech) showed how rapid sedimentation in the Salton Trough resulted in the formation of new crust, delayed continental breakup and seafloor spreading, and how metamorphism of sediment can further delay final crustal breakup. Rob Gawthorpe (Colorado School of Mines) ended the session with insights on the evolution of the Corinth Rift, Greece from the onshore-offshore observations.

The final science session highlighted hazards in rifts and rifted margins. Karen Fontijn (Oxford) focused mainly on volcanic hazards in the East African Rift, emphasizing the low viscosity of rift magmas, the high potential for phreatic eruptions, and the abundance of large caldera systems as well as the role of hazardous CO2 degassing. Atalay Ayele (Addis Ababa U.) highlighted the challenges in disaster risk management in Africa that are due to limited capacity in equipment and human resources and the general level of understanding of potential risk. He also pointed to recent successes such as capacity building efforts, advances in real-time data flows, and national workshops. Maurice Lamontagne (GSC) showed how earthquakes and tsunamis related to rifting are the main hazards in Eastern Canada and how detailed mapping of ancient fault structures provides key insights on earthquake mechanisms and distributions in the region. Sang Mook Lee (SNU) highlighted the geohazards of the East Sea and the Sea of Japan and their potential to affect nuclear power plant safety.

Collaborative opportunities were discussed with presentations on the RiftVolc initiative, connections between rifting and hydrology, EarthScope and Africa Array updates.

Science themes with opportunities for near-term future studies

The TEI was designed to provide ample opportunities for participants to ask questions and discuss scientific issues related to the presentations. This was achieved through a panel discussion following each session including all speakers. Additional focused discussions occurred during two breakout sessions and small group discussions, which focused on the identification of high priority science questions and work needed to tackle these questions.

The following major science themes emerged from discussions at the TEI. For each of these themes, discussions focused on exciting recent findings and opportunities for near-term research progress through the GeoPRISMS RIE TEI initiative.

1. Tracking fluids (volatiles and magmas) through the lithosphere and with time

The importance of fluids for a spectrum of interconnected processes throughout the life of rifts and rifted margins was a topic of significant interest at the meeting. Meeting presentations covered recent results that have revealed strong, nonlinear interactions between volatiles and faults (e.g., talk by Muirhead), the important influence of prerift and synrift metasomatic events on magmatism (e.g., talk by Sana), and the capacity of fluids to advect heat and strongly modulate the thermal structure of rifts (e.g., talk by Harris). Geochemical tracers can be used to constrain the modification of the lithosphere by magmatic events (e.g., talk by Class). New studies of rifted margins also reveal unexpected mantle structure and magmatism, hinting at active processes long after rifting (e.g., talk by Lynner).
These new science results point to several exciting near-term future science directions:

  • Understanding the connections between deep volatiles and shallow observations, including constraining magma and volatiles residence times and pathways
  • Developing a quantitative understanding of the impact of volatiles/magmatism on strain localization and rheology (connects to theme 2)
  • Connecting general rheological models to morphological and process-based differences between magma-poor and magma-rich regions
  • Investigating the origin and significance of post-rift magmatism on rifted margins

2. Controls on deformation and localization at different temporal scales

Elucidating controls on deformation and localization are central to understanding rift processes, and were another major focus of meeting presentations and discussions. Magma is clearly a great localizer of strain (e.g., talks by Buck, Ebinger), but magma is not present everywhere, at least not in abundance. In magma-poor locations, fluids, pre-existing structures and/or chemical heterogeneity may be important factors (e.g., talks by Van Avendonk, Eilon). Volatiles appear to influence crustal rheology and fault behavior (e.g., talks by Muirhead, Ebinger), but are still poorly understood. The role of pre-existing lithospheric structure in strain localization appears to vary among rift systems and at different scale lengths (e.g., talks by Lynner, Eilon).

New numerical models and observations suggest that surface processes may also control strain localization (e.g., talks by Olive, Han; connects to theme 3). The slip behavior of rift faults (creeping, locked, etc.) is poorly known (e.g., talk by Mark), and there are few constraints on how it might change over time or with rift evolution (e.g., talk by Van Avendonk).

These new science results point to several exciting near-term future science directions:

  • Integration of rifting processes across a range of time scales from the earthquake cycle to geologic time
  • Characterization of slip behavior of faults over time and space
  • Understanding variations in temporal/spatial patterns of deformation between magmatic and magma-poor systems
  • Comparing transient behavior in rifts (creep, slow slip) to subduction and transform zones
  • Observing how volatiles are distributed through lithosphere (connects to theme 1) with an emphasis on how they impact rheology, faulting, and transient deformation
  • Constraining mantle rheology on a variety of time scales and as a function of volatile abundance, metasomatism and melt extraction processes (connects to theme 1).

3. Surface mass sedimentary fluxes and feedbacks with rifting

Recent studies have demonstrated strong connections between surface processes and all stages of rift evolution. These include the formation of new crust through rapid sedimentation (e.g., talk by Han), the impact of erosion on fault evolution (e.g., talk by Olive), the structural control of sediment pathways during and long after rifting (e.g., talk by Gawthorpe), and the structural control of slope failure (e.g., talks by Brothers and Lamontagne). The vertical displacements and crustal architecture associated with extensional tectonics strongly influence the spatial and temporal distribution of depositional domains (e.g., talks by Straub, Brothers).
These results point towards several important near-term future science directions:

  • Developing more comprehensive sedimentary histories of rifts to improve understanding of rift-related mass transport
  • Improving conceptual and numerical models of sediment influence on extensional processes, including thermal and mechanical feedbacks (connects to theme 2)
  • Utilizing the extant and paleolake systems for integrated investigations of landscape evolution.

Efforts needed to make progress on themes within GeoPRISMS

To address outstanding questions related to the themes above, the following future efforts were highlighted as particularly important.

Synthesis

Comparing among and within rifts is important to address many of the overarching RIE science questions and the specific questions within the themes above. A growing volume of data is now available in both primary sites and in other rift systems on everything from surface processes to magmatism and deep geodynamics. These observations include existing geophysical datasets on both EAR and ENAM from GeoPRISMS and other efforts, growing geochemical data and drilling data in various rifts. Particular themes discussed for syntheses were:

  • Geochemical variations along/across ENAM/EAR
  • Sediment mass fluxes from existing (limited) drilling data
  • Geochronological data on magmatic/volcanic events and surface processes
  • Crustal/lithospheric structure of rifts from existing geophysical imaging, with focus on comparisons between and within systems with variable magmatism
  • Geochemical data from geothermal exploration projects (drilling) in volcanic and non-volcanic settings.

New data collection and experimental/numerical work

From discussion at the meeting, it is clear that new data and experiments are required to tackle many important science themes, and several key gaps emerged from discussions at the meeting. Below are examples:

  • Studies of volatile systems to understand their distribution/abundance/residence time at various levels in the lithosphere. This would involve integrated geophysical imaging including but not limited to MT, seismic, and detailed geochemical studies such as melt inclusions, sampling volatiles at the surface, high density flux measurements, and other approaches.
  • Experimental and numerical modeling directed at the impact of volatiles and lower crust/mantle lithosphere hydration state/compositions on deformation throughout the lithosphere,
  • Observations to constrain the time scales of processes are needed. These include but are not limited to more geodetic observations to understand average rates and observe transient events as well as investigations of paleoseismology, deformed volcanic ash markers, and tectonic geomorphology to understand longer term accommodation of strain by events. On a longer time scale, better and improved geologic timing information is needed.
  • New constraints on sedimentary fluxes in rifts including but not limited to cosmogenic dating techniques, river incision rates, and obtaining data from new drill cores.
  • Advance the understanding of landscape evolution through better access to high resolution topographic data. ■

 icon-chevron-right For more information and browse the collection of archived presentations, please visit the TEI webpage

Report on the NSF-GeoPRISMS Rift Initiation and Evolution Theoretical and Experimental Institute . T. Fischer, D. Shillington

GeoPRISMS Newsletter, Issue No. 38, Spring 2017. Retrieved from http://geoprisms.nineplanetsllc.com

Spotlight | Complex upper mantle structure beneath the East African Rift System


Erica Emry1, Andrew Nyblade2, and Yang Shen3

1New Mexico Tech, 2Penn State University, 3University of Rhode Island

The East African Rift System (EARS) was one of the GeoPRISMS primary sites within the theme of Rift Initiation and Evolution, because of the variety of rifting stages and styles exhibited along this margin and because of the number of science questions that can be addressed there. Along this margin and in neighboring regions of Africa, Europe, and the Middle East, many broadband seismic instruments have been previously deployed, and numerous studies have explored the subsurface structure over a broad range of scales. However, there is often a disjoint between features that had been previously imaged through smaller-scale, regional tomographic inversions and those imaged by larger-scale inversions. In a recent tomographic study of the upper mantle beneath Africa, we used a full-waveform tomography method, constrained by long-period signal from ambient seismic noise to image the upper mantle beneath Africa to the top of the mantle transition zone (Emry et al., 2019). We found good agreement with prior models, at both large and regional scales, and we imaged new features in higher detail beneath more poorly resolved segments of the EARS. Here, we highlight the overall patterns along the EARS and focus on the complexity observed beneath the Turkana region.

What did we do?

We gathered continuous seismic data for more than 800 seismic stations and extracted Rayleigh waves from ambient seismic noise at periods as high as 340 seconds (Shen et al., 2012). Long period signal is valuable, because it is sensitive to structure deeper in the upper mantle and allows us to resolve down to about 350 to 400 km. Of the more than 800 seismic stations, we identified stations that provided clear signal at 40-340 seconds and used them to constrain our inversion (Fig. 1). This was a new set of data that had not yet been used to image the deeper lithosphere and asthenosphere beneath Africa.

Figure 1. Station map modified from Emry et al. (2019). Cratons are outlined in thick black lines. Blue triangles denote stations for which ambient noise data were collected and red triangles show stations that were used to invert for tomography. Abbreviations are as follows: AF-Afar, AP-Arabian Peninsula, DB–Damara Belt, KpC–Kaapvaal Craton, LR–Luangwa Rift, MER–Main Ethiopian Rift, MR–Malawi Rift, OR–Okavango Rift, RVP–Rugwe Volcanic Province, SS–South Sudan, TC–Tanzania Craton, TD–Turkana Depression, VVP–Virunga Volcanic Province, ZC–Zimbabwe Craton.

Figure 2. Two depth slices showing shear velocity at a) 165 km and b) 424 km, modified from Emry et al. (2019). For each depth, the color scale (m/s) is centered around the shear velocity in AK135 for that depth. Coastlines are shown as thin black lines, gray and blue lines indicate velocities that are 1.7% and 5% greater than AK135 model. Gray triangles show stations that inform the inversion. Abbreviations are as in Figure 1.

Although other seismic phases are often used to constrain full-waveform tomographic models, we used Rayleigh waves, as it is the principal phase extracted from seismic ambient noise. We used high-performance computing (HPC) clusters at the University of Rhode Island Graduate School of Oceanography to simulate waves propagating through a laterally variable Earth structure. Once synthetic waveforms were calculated for each seismic source in the model, we measured misfit between synthetic Rayleigh waves and those extracted from the data, determined the volume of Earth that influences the traveling wave, and inverted to identify a better-fitting model. For each new model, these steps were repeated until minimal change was made to the model. Our final results provide the absolute, isotropic, shear wave velocity (Fig. 2).

New results from the East African Rift System

There were many similarities between our results and prior studies of the EARS in regions where dense seismic or magnetotelluric arrays have been previously located (Benoit et al., 2006; Bastow et al., 2008; Adams et al., 2012; Mulibo and Nyblade, 2013; O’Donnell et al., 2013; Civiero et al., 2015; Gallacher et al., 2016; Accardo et al., 2017; Yu et al., 2017; Sarafian et al., 2018). As in prior models, we saw abundant indications for mantle upwellings or plumes as well as a pattern of lower velocities at shallow upper mantle depths in the northern EARS and higher velocities at shallow depths in the southern EARS. However, in our results, the patterns of low-velocities at middle upper mantle depths were laterally discontinuous along the full length of the EARS, and we imaged variable lithospheric topography that may influence the shallow flow of mantle upwellings.

Segmented upwellings beneath East Africa

Beneath the EARS, we imaged low-velocities at mantle transition zone (MTZ) depths, but at middle upper mantle depths, we imaged persistent patterns of separation between low-velocity features. While we have confidence in the pattern of separation within the upper mantle, we cannot resolve small features at deep depths and therefore cannot be certain whether the separation at shallower depths continues into the MTZ. At the shallowest upper mantle depths, the low-velocities appear to be overall more connected than at the middle upper mantle and are located mostly beneath the rift axis. In many regions, at shallow and middle upper mantle depths, the low-velocity anomalies are located adjacent to or between high-velocity features.

This pattern provides an overall sense that distinct buoyant upwellings, presumably of a thermal or thermochemical nature, are rising through the upper mantle and that their paths are likely influenced at shallow depths by rigid, presumably lithospheric, structures. Ultimately, it appears that these upwellings are sourced from MTZ depths. Such a pattern of secondary upwellings could be sourced by a deeper, ponded anomaly at or beneath the mantle transition zone, as has been previously suggested for the EARS from seismic and geochemical observations (Kieffer et al., 2004; Furman et al., 2006; Bastow et al., 2008; Huerta et al., 2009; Mulibo and Nyblade, 2013; Civiero et al., 2015). This pattern of buoyant upper mantle upwellings appears to be occurring along much of the EARS, and also in some other regions of Africa, however we note that fewer upwellings were imaged beneath the less evolved southern and western segments. In our view, this may be due to the history of upwellings or to the generally thicker lithosphere in the south and west that may act to divert upwellings.

Complex upper mantle beneath Turkana

One region that is most suggestive of a complex upwelling and diversion process is beneath the Turkana and South Sudan region. Here, the upper mantle has been difficult to image due to a lack of broadband seismic instrumentation. The Turkana segment is part of the primary EARS focus site and is particularly unique with regards to other segments of the EARS, because of the broad, diffuse rifting pattern and history of previous rifting oblique to the current-day trend (Brune et al., 2017; Ebinger et al., 2017).

Beneath this region, the indication of a low-velocity anomaly at deep upper mantle and mantle transition zone depths was most prominent (Fig. 3c). Directly above this, at middle upper mantle depths, a high-velocity feature was identified in the west beneath South Sudan, and the lowest velocities at these depths were located immediately adjacent to the high-velocity feature, to the north and to the southeast and southwest (Fig. 3b). Above this, at the shallowest upper mantle depths, the lowest velocities were imaged to the east beneath Lake Turkana. At these shallowest depths to the west beneath South Sudan, slightly slow to average upper mantle velocity was observed, while the fastest structure was located to the south and southwest beneath the laterally continuous Uganda and Bomu-Kibalan Cratons (Fig. 3a).

Figure 3. Three depth slices from the Turkana-South Sudan and Ethiopian Plateau regions showing shear velocity at a) 123 km, b) 260 km, and c) 424 km, modified from Emry et al. (2019). Cross-sections correspond to lines plotted on a. Abbreviations explained in Figure 1.

This pattern may suggest that rising asthenosphere is being diverted north and south around a lithospheric structure within the middle upper mantle beneath South Sudan. However, it is difficult to be certain of the spatial relationship and possible connection between this high-velocity feature and the Uganda and Bomu-Kibalan Cratonic roots located at shallower depths to the south and southwest. At this this point we can only speculate whether the structure is part of a stable, deep lithospheric root or whether it is sinking or foundering lithosphere (see discussion in Emry et al., 2019). However, we expect that this feature may affect the style of rifting, patterns of magma-rich vs. magma-poor extension, and connections between the Main Ethiopian Rift and the Eastern and Western Branches.

Summary

Overall, the EARS shows variability in lithospheric topography and reveals regions where the lithospheric structure may be affecting the path of upwellings at shallow and middle-upper mantle depths. However, there is also a clear sense of distinct upwellings within the upper mantle that might be sourced from a common, deeper anomaly. Our results of the upper mantle and mantle transition zone are useful in understanding the spatial relationships and possible connections between different segments and we hope that they will aid the overall goal of synthesis.

Acknowledgments


We thank the NSF Earth Sciences Postdoctoral Fellowship program for supporting this research (EAR-1349684). The shear velocity model from Emry et al. (2019) is available through the IRIS-EMC and through the GeoMapApp tool. We thank Manochehr Bahavar from the IRIS-EMC and Andrew Goodwillie from IEDA-GeoMapApp for helping to format the model and make it available.

Because our data came from ambient seismic noise, it was necessary that stations had temporally overlapping records. In this regard, the sparsely distributed long-term seismic deployments, such as the GSN, GEOSCOPE, AfricaArray (see photos), and MedNet were irreplaceable, and allowed us to also incorporate several 1-2 year (‘PASSCAL-type’) seismic deployments throughout Africa and the surrounding regions. ■

References

Accardo, N.J., J.B. Gaherty, D.J. Shillington, C.J. Ebinger, A.A. Nyblade, G.J. Mbogoni, P.R.N. Chindandali, R.W. Ferdinand, G.D. Mulibo, et al. (2017). Surface wave imaging of the weakly extended Malawi Rift from ambient-noise and teleseismic Rayleigh waves from onshore and lake-bottom seismometers. Geophys. J. Int., 209(3), 1892-1905
Adams, A., A.A. Nyblade, D. Weeraratne (2012). Upper mantle shear wave velocity structure beneath the East African plateau: Evidence for a deep, plateauwide low velocity anomaly. Geophys. J. Int., 189(1), 123-142
Bastow, I.D., A.A. Nyblade, G.W. Stuart, T.O. Rooney, M.H. Benoit (2008). Upper mantle seismic structure beneath the Ethiopian hot spot: Rifting at the edge of the African low-velocity anomaly. Geochem. Geophys. Geosys. 9(12), Q12022
Benoit, M.H., et al. (2006). Upper mantle P-wave speed variations beneath Ethiopia and the origin of the Afar hotspot. Geology, 34(5), 329-332.
Brune, S., et al. (2017). Controls of inherited lithospheric heterogeneity on rift linkage: Numerical and analog models of interaction between the Kenyan and Ethiopian rifts across the Turkana depression. Tectonics, 36, 1767-1786
Civiero, C., J.O.S. Hammond, S. Goes, S. Fishwick, A. Ahmed, A. Ayele, C. Doubre, et al. (2015). Multiple mantle upwellings in the transition zone beneath the northern East-African Rift system from relative P-wave travel-time tomography. Geochem. Geophys. Geosys. 16, 2949-2968
Ebinger, C.J., D. Keir, I.D. Bastow, K. Whaler, J.O.S. Hammond, A. Ayele, M.S. Miller, C. Tiberi, S. Hautot (2017). Crustal structure of active deformation zones in Africa: Implications for global crustal processes. Tectonics, 36, 3298-3332
Emry, E.L., Y. Shen, A.A. Nyblade, A. Flinders, X. Bao (2019). Upper mantle Earth structure in Africa from full-wave ambient noise tomography. Geochem. Geophys. Geosys. 20, 120-147
Furman, T., Bryce, J., Rooney, T., Hanan, B., Yirgu, G., Ayalew, D. (2006). Heads and tails: 30 million years of the Afar plume. In G. Yirgu, C. J. Ebinger, P. K. H. Maguire (Eds.), The Structure and evolution of the East African Rift System in the Afar Volcanic Province, Geological Society of London Special Publications, 259, 95-119. doi.org/10.1144/GSL.SP.2006.259.01.09
Gallacher, R.J., D. Keir, N. Harmon, G. Stuart, S. Leroy, J.O.S. Hammond et al. (2016). The initiation of segmented buoyancy-driven melting during continental breakup. Nature Communications. 7, 13110
Huerta, A.D., A.A. Nyblade, A.M Reusch (2009). Mantle transition zone structure beneath Kenya and Tanzania: More evidence for a deep-seated thermal upwelling in the mantle. Geophys J. Int. 177(3), 1249-1255. doi.org/10.1111/j.1365-246X.2009.04092.x
Kieffer, B., N. Arndt, H. Lapierre, F. Bastien, D. Bosch, A. Pecher, et al. (2004). Flood and shield basalts from Ethiopia: Magmas from the African superswell. Journal of Petrology, 45(4), 793-834
Mulibo, G.D., A.A. Nyblade (2013). The P and S wave velocity structure of the mantle beneath eastern Africa and the African superplume anomaly. Geochem. Geophys. Geosystems, 14(8)
O’Donnell, J.P., A. Adams, A.A. Nyblade, G.D. Mulibo, F. Tugume (2013). The uppermost mantle shear wave velocity structure of eastern Africa from Rayleigh wave tomography: Constraints on rift evolution. Geophys. J. Int., 194(2), 961-978
Sarafian, E., R.L. Evans, M.G. Abdelsalam, E. Atekwana, J. Elsenbeck, A. G. Jones, E. Chikambwe (2018). Imaging Precambrian lithospheric structure in Zambia using electromagnetic methods. Gondwana Research, 54, 38-49
Shen, Y., et al. (2012). An improved method to extract very-broadband empirical green’s functions from ambient seismic noise. Bulletin of the Seismological Society of America, 102(4), 1872-1877
Yu, Y., et al. (2017). Mantle structure beneath the incipient Okavango rift zone in southern Africa. Geosphere, 13(1), 102-111

Reference information

Spotlight | Complex upper mantle structure beneath the East African Rift System. E. Emry, A. Nyblade, Y. Chen
GeoPRISMS Newsletter, Issue No. 42, Spring 2019. Retrieved from http://geoprisms.nineplanetsllc.com

HT-RESIST Hikurangi Trench Regional Electromagnetic Survey to Image the Subduction Thrust


Christine Chesley with Samer Naif and Kerry Key
LDEO, Columbia University

Because New Zealand’s north island lies at the juncture between the converging Pacific and Indo-Australian plates, it is not surprising that the area experiences earthquakes. A unique feature of the Hikurangi margin, the name of New Zealand’s subduction zone, is that its earthquake slip behavior varies from north to south along strike. The northern Hikurangi margin is characterized by shallow slow slip events (SSEs) and weak seismic coupling while the southern margin exhibits deeper SSEs and stronger coupling. The host of other properties that change along this subduction zone have motivated the question, “What controls the along-strike variation in megathrust behavior at the Hikurangi margin?”
One key element of this question lies in quantifying the porosity and fluid budget along the margin. Marine electromagnetic (EM) methods are well-suited for imaging fluids and fluid pathways within the lithosphere. Of course, a major caveat to any geophysical survey of convergent margins is the challenge of collecting good data on the seafloor beneath a deep ocean. So that is what we set out to do on 16 December 2018.

Figure 1. Survey map showing location of leg 1 OBEM deployments (green triangles), leg 2 OBEM deployments (magenta squares), CSEM tows (peach lines), and GNS land receivers (white and blue circles). Inset shows regional tectonics (from http://volcano.oregonstate.edu).

“We know about earthquakes here in Wellington,” asserted a waiter at the Thistle Inn. After a satisfying meal, my colleague and I were giving an abridged rundown of our cruise objectives to this excited employee. It was a day or so before we would leave for a month-long voyage to deploy ocean bottom electromagnetometers (OBEMs) for controlled-source electromagnetic (CSEM) and magnetotelluric (MT) imaging of the subseafloor off New Zealand’s north island. Curious about our business in New Zealand, our waiter warned us that talking about earthquakes was making people anxious in his country. Somehow, it was refreshing to find a non-geophysicist who thought our work was important. But it also impressed upon me the urgency to make this cruise a success.

The cruise itself was divided into two legs, both of which were carried out on the R/V Roger Revelle. The first and longer of the two legs involved the collection of the four lines of CSEM data shown in Figure 1, in addition to the deployment of 42 OBEMs for collection of passive MT data. I had never been to sea for more than a few hours – as a geophysics PhD student, I would spend most of my days in front of a computer rather than performing manual labor. I am pretty accustomed to having stable ground beneath my feet and a bed that doesn’t rock at night.

Everything about the experience was new for me.

Before the cruise, I had only ever read about how our marine EM group collects data. Getting a firsthand look at the process has given me a tremendous amount of respect for how much effort goes into data collection, especially when things don’t go according to plan.

During the first leg of the cruise, the science crew consisted of eight researchers – five PhD students, two postdocs, and our Principal Investigator, Samer Naif, who led this cruise for the first time as Chief Scientist. The crew also included two Scripps EM Lab technicians and two Research Technicians to operate the cranes and supervise our actions on deck, making sure we were following safety protocols. Each twelve-hour shift counted six extremely hardworking individuals. Steady seas and mild to warm weather persisted for the majority of the first cruise, helping us ease into our sea legs and avoid seasickness.

Though we faced noteworthy obstacles in securing each line of CSEM data, the first line has given every one of us an answer to that age old interview question on describing a challenge we overcame. We began by deploying 38 of the Scripps OBEMs in just 24 hours, a nontrivial task as only five members of our entire team had ever assembled these receivers before the cruise. Receivers are the heart and soul of any data collection survey, and the Scripps OBEMs are broadband systems that continuously measure the horizontal components of natural and induced electromagnetic field energy. Such energy propagates through the Earth’s lithosphere in a manner that should depend on its electrical conductivity, which in turn depend in part on variations in fluid content. Proper assembly of the receivers is the first step to ensuring quality data recovery. I appreciated the inexhaustible patience shown by our Scripps EM Lab technicians, Jake Perez and Chris Armerding. From explaining to re-explaining how to use a torque wrench, test the acoustics on our receivers, properly affix electrodes, or attach a concrete block to the base of the receiver, Jake and Chris transformed our group of mostly inexperienced grad students into capable field workers. They showed us the multifaceted usefulness of 3M Scotch 35 electrical tape and cable ties that held electrodes, copper, or wires in place and always seemed to find a home in the pockets of my work pants.

Still jet-lagged and adjusting to twelve hours of manual labor per day, the first line of deployments was the most taxing. Nevertheless, the successful deployment of the receivers provided some reprieve as the next step was to tow our active source instrument, SUESI, the Scripps Undersea Electromagnetic Source Instrument. SUESI’s sharklike body tows behind it both long (~300 m) and short (~10 m) antennas terminated by thirty meter copper electrodes. By attaching SUESI to the ship’s winch using a standard oceanographic 0.680” coaxial deep-tow cable, we can send an alternating electric current from the ship to SUESI. SUESI then rectifies the signal and converts it from high voltage to a high current rectangular waveform that gets injected into the seawater across the copper electrodes. Thus, SUESI’s antennas behave as an EM dipole whose energy propagation can be used to probe the shallow lithosphere. As we started deploying SUESI, Poseidon decided it was time to pay for the nice weather and brisk pace we had enjoyed until then. After the arduous process of assembling, deploying, and lowering SUESI into the depths of the ocean, one of her copper antennas partially snapped. We had to haul SUESI back on board, repair the antenna, and deploy her down into the ocean again, a process that took several hours of deckwork. Hopefully, that was enough excitement to last the entire month. But no. The next day brought with it an inexplicable malfunction that led to yet another retrieval of SUESI. Perhaps she did not like the west Pacific water all that much. Thankfully, our Chief Scientist Samer Naif and lab techs Jake and Chris had planned for the unexpected and brought SUESI’s sister along, as a spare. We had better luck with the second SUESI and ended up relying on her for the remainder of the cruise.

Upon recovering SUESI at the end of the tow, it was time to retrieve the OBEMs to use them for the second line. Even with a heavy concrete block to carry the receivers to the seafloor (Fig. 1), ocean currents can move the OBEMs laterally away from the drop site during their descent through the water column. Once on the seafloor, it is necessary to know the exact location of the OBEM to accurately model the CSEM data. This is achieved by measuring the time it takes for an acoustic pulse sent from the ship to be repeated by the OBEM receiver. Similar to a game of “Marco Polo,” the ship sends and receives these acoustic signals at multiple locations until we have enough information to deduce where the receiver resides. We then send a specially coded acoustic signal to release the OBEM from its concrete block. Once the receiver floats to the surface, the team must act quickly to fish it out of the water. For me, retrieving the surfaced OBEMs was the most nerve wracking part of the process. What if we didn’t throw the grappling hook far enough? What if we couldn’t hook the receiver to the crane? What if the GPS buoy malfunctioned and the receiver couldn’t be located? Despite these worries, we managed to recover every single OBEM that we deployed for CSEM data, not only for the first line but for each of the next three as well – a total of 128 stations.

And what beautiful data we retrieved.

Between steak nights and fish tacos, rom coms and Coen Brothers movies, podcasts on olive oil and speculations about giant squids breaking our instruments, we collected three more lines of CSEM data following a similar routine of deploy-tow-recover. We learned to tie bowlines, clove hitches, and square knots. We watched sunrises, sunsets, witnessed dolphins playing with the bow and participated in safety drills of varying theatrics. And when all was said and done, we would manage to gather 20% more CSEM data than initially planned.

With the CSEM portion of the cruise over, we deployed all 42 OBEMs for the passive source MT portion of the project. Though broadband OBEMs can simultaneously collect CSEM and MT data, we left the receivers on the seafloor for about one month to collect higher quality, long-period MT data. This allowes us to look deeper into the Earth to learn about the lithosphere-asthenosphere system.

The second leg of the cruise in February 2019 involved recovering the OBEMs from the MT deployment phase. This leg included thirteen participants, five of whom were based in New Zealand. Though I did not participate in the second cruise, I was thrilled to hear that all 42 receivers were recovered despite the gnarly weather the team encountered. Taken together with the first cruise, it means a perfect recovery rate for all 170 deployments.

Combined data with the land MT sites collected by GNS Science, New Zealand, this is the largest amphibious EM dataset to date. I am thrilled to be working on this tremendous amount of data for the remainder of my PhD and excited to find what secrets they will unlock about the nature of the Hikurangi margin.

>> It was very educating and fun to work with instruments other than the ones I am used to from my institute. I also took home some ideas for organizing science on research vessels, which might benefit my work group.

– Gesa Franz

>> Even when the waves were high and we could surf in a chair inside the Roger Revelle it was an amazing personal and scientific experience. In my particular case, as a person used to coding and doing mathematics, to do ‘real’ science was very inspiring.

– Julen Alvarez-Aramberri

>> Doing fieldwork at sea gave me a whole new sense of what it means to do science, to be a scientist. It is so much more than analyzing or modeling data on a computer in the mundane safety of an office. We were out on deck in 40 knot winds and six meter seas. Science tests your body and your resolve, not just your mind. Just being on a research vessel dedicated solely to advancing our understanding of our amazing planet was inspiring. And then, of course, there were the sunrises, the stars, and the dolphins.

Daniel Blatter

Reference information

HT-RESIST Hikurangi Trench Regional Electromagnetic Survey to Image the Subduction Thrust. C. Chesley, S. Naif, K. Key
GeoPRISMS Newsletter, Issue No. 42, Spring 2019. Retrieved from http://geoprisms.nineplanetsllc.com

Putting the “Community” in the Alaska Amphibious Community Seismic Experiment (AACSE): Alaska Peninsula and Western Gulf of Alaska, Summer 2018


The AACSE Team*

*This report was edited and compiled by Lindsay Worthington.

AACSE PI team: Geoff Abers (Lead PI, Cornell U.), Aubreya Adams (Colgate U.), Peter Haeussler (USGS), Emily Roland (U. of Washington), Susan Schwartz (U. of California Santa Cruz), Anne Sheehan (U. of Colorado), Donna Shillington (Lamont Doherty Earth Observatory), Spahr Webb (Lamont Doherty Earth Observatory), Doug Wiens (Washington U. St. Louis), Lindsay Worthington (U. of New Mexico).

2018 Apply-to-Sail Participants: Collin Brandl (Graduate Student, U. of New Mexico), Enrique Chon (Graduate Student, U. of Colorado), David Heath (Graduate Student, Colorado State U.), Robert Martin-Short (Graduate Student, U. of California Berkeley), Kelly Olsen (Graduate Student, U. of Texas), Holly Rotman (Postdoctoral Researcher, New Mexico Tech), Samantha Hansen (Associate Professor, U. of Alabama), Tiegan Hobbs (Graduate Student, Georgia Tech), Amanda Price (Graduate Student, Washington U. St. Louis), Heather Shaddox (Graduate Student, U. of California Santa Cruz), Jefferson Yarce (Graduate Student, U. of Colorado Boulder), Natalia Ruppert (Seismologist, U. of Alaska Fairbanks)

K-12 Educators On Board: Shannon Hendricks (High School Science Teacher, Anchorage School District), Bethany Essary (High School Science Teacher, Anchorage School District).

The shore-based field teams included graduate student Michael Mann (Lamont-Doherty Earth Observatory) and undergraduate student Jordan Tockstein (Colgate U.). We thank the captain and crew of the R/V Sikuliaq and the pilots, boat captains and land owners that made these deployments possible. Special thanks to Bill Danforth from the USGS for his bathymetric processing expertise aboard Leg 2 and Patrick Shore from Washington U. for coordinating onshore field logistics and preparing the data for delivery to the DMC.

If you visit Alaska and tell people that you are a seismologist, you are going to hear an earthquake story. The Alaska-Aleutian subduction system is arguably the most seismically active globally, producing more >M8 earthquakes over the last century than any other. As a result, earthquake and tsunami hazard are woven into daily life here. Near downtown Anchorage, you can visit Earthquake Park, occupying part of town that was decimated by a landslide during the 1964 M9.2 event that inspired the term “megathrust” earthquake. If you happen to be in Kodiak on a Wednesday afternoon, you will hear the weekly tsunami siren drill sound throughout the town. Earlier this year that drill was put in to practice as residents made their way through the tsunami evacuation process, meeting up at the school on high ground after midnight on January 29 following the M7.9 earthquake that occurred offshore.
So, how do you study an 800 km section of this subduction zone that is mostly offshore or only accessible via air or boat? Simple. Start with nine Principal Investigators (PIs) and dozens of conference calls; take 85 ocean bottom seismometers (OBS), thirty broadband seismometers, one fishing boat, two float planes, two fixed wing planes, a helicopter, and a 261-ft research ship; add a team of twelve OBS engineers, 24 ships crew, twelve Apply-to-Sail participants, two Alaskan K-12 teachers and two field technicians. Then make the data open and accessible as quickly as possible. This is the Alaska Amphibious Community Seismic Experiment (AACSE) and these are voices from the field.

The Alaska Amphibious Community Seismic Experiment (AACSE) deployment map prepared by Peter Haeussle

OBS Deployment Cruise Leg 1 | Seward, AK to Seward, AK – May 9-29, 2018

>> 9 May, 2018 | We are officially underway • It is 8:30am and we are departing Seward dock. We have donned our full-body immersion suits as part of a safety drill, and are now heading towards the first seismometer deployment site, lying in the Shelikof Strait just north of Kodiak Island. We are on one of the most modern and well-equipped scientific research ships in the world. The R/V Sikuliaq was built in 2014 and has a science lab, lounge, dining room, kitchen, gym, and the list goes on. There is even a sauna which apparently can double as a hypothermia recovery room – let’s hope we won’t be using it for that purpose. For cabins, we are treated to the height of oceanographic luxury. The rooms are practical and very comfortable. The Sikuliaq takes its name from the Inupiaq word that means “young sea ice”. Thanks to its round hull, the ship is capable of breaking ice up to 2.5 ft thick, which is essential on polar missions. This also gives it a tendency to move around more in high seas. As we travel, we will be collecting meteorological data such as pressure, temperature, and wind speed. We will also be recording bathymetry data to map the seafloor.

-Robert Martin-Short, University of California Berkeley

>> 10 May, 2018 | Deploying the first OBS instrument • The first OBS (Ocean Bottom Seismometer) is a shallow-water Trawl-Resistant Mounted Seismometer (TRMS), design to resist and deflect the lower leading line of bottom trawl nets. All of the OBSs are instrumented with a seismometer, batteries to last more than fifteen months, transponders to communicate with the ship and burn the wire to release the seismometer for recovery, data logger, temperature sensors, and other equipment necessary to collect these data. The shell for the TRMS itself weighs about 1,300 lbs, the whole instrument weighs about 1,800 lbs. The deployment is a success! After deploying the TRMS, we have to hide from foul weather in Larsen Bay, then assemble more TRMSs. This involves removing the doors and installing brackets to hold equipment, attaching hoods to the pop-up TRMS, checking the transponders to make sure they are properly communicating with the ship, and attaching the transponders. We will stay in the cove and work for a couple hours, then leave once the storm has passed.

-David Heath, Colorado State University

>> 12 May, 2018 | Waiting out the storm • Many of us are taking to personal hobbies and pastimes in between routine status logging. Some people are reading quietly. Others are attempting to catch up on emails, though the internet is particularly slow. Others are taking the opportunity to chat with shipmates, many of whom are still practically strangers after few days on the ship. I am learning that life on a ship provides a unique opportunity for people to connect with each other. I have spent part of the evening receiving a generous guitar lesson from the Chief Steward who is a skilled blues musician. He kindly reached out to play alongside me when he noticed me strumming out on deck. I’ve got to say, my experience thus far has been pretty great, despite the spotty weather and fits of acute nausea.

-Enrique Chon, University of Colorado

OBS Deployment Cruise Leg 2 | Seward, AK to Seward, AK; July 11-24, 2018

>> 11 July, 2018 | Educators Onboard • There are so many people involved in a research cruise like this. There is an entire ship crew, scientists, graduate students, USGS employees, OBS technicians, and, on this trip, there are even two high school science teachers and I am one of those. I am stoked to be on board. My colleague, Shannon Hendricks, and I were selected as part of the Educator Onboard K12 program. Through this program, educators are given the opportunity to participate in research to better understand current science practices. The goal is to use that knowledge to create engaging, authentic lesson plans to share with other educators. It is a little intimidating to meet all of these experts – as science teachers, we know a little bit about a lot of things, and we have a solid enough science foundation to understand what the experts are talking about (most of the time!). This also means we know enough to realize how much we don’t know! It is amazing to get to learn from scientists that have made this their life work. Getting to peek in on their ongoing research makes us better science teachers. And it is nice to know that, just like we tell our own students, there are no stupid questions.

-Bethany Essary, West High School science teacher, Anchorage, AK

>> 23 July, 2018 | The aftershock zone • Day 12 of the cruise, we have just successfully deployed our last OBS, 32 hours ahead of schedule! Half way through this cruise, we decided to move one of the instruments to near the aftershock zone of the M7.9 Offshore Kodiak earthquake. It struck about three hundred kilometers offshore Kodiak Island in the early morning hours of January 23, 2018, in the outer rise region of the Alaska-Aleutian subduction zone. It triggered tsunami warnings and prompted evacuations of thousands of people in Alaskan coastal communities. While the source parameters (such as seismic moment tensor) for the earthquake suggested strike-slip faulting (hence no significant tsunami generated), the true complexity of the source has only become evident through analysis of multiple datasets. At least four conjugate strike-slip faults were involved in the earthquake rupture. However, the distant location of the aftershock source region to the land-based stations made the data analysis and interpretation difficult. On the Leg 1 cruise, a couple of stations were serendipitously placed near or in the aftershock zone. After consultations with the PI group we moved this station to the aftershock cluster. This enhanced network of OBS sensors in the aftershock zone will help characterize the aftershock sequence with much better accuracy.

-Natalia Ruppert, University of Alaska

>> 24 July, 2018 | Good luck • For the past three years, I have been looking at OBS data off the east coast of New Zealand’s North Island, and I always wondered about the logistics behind the dataset of earthquakes. It turns out that deploying ocean bottom seismometers is a huge task that includes multiple people. This experience exceeds all my expectations. I imagined a repetitive process, but every single station has its own challenges: the bathymetry indicates a rough or steep relief so we have to move somewhere close by with a more flat and soft bathymetry; we need to be sure that the temperature sensors are the ideal for specific depths; we fill the sheets with station information and log it in our physical and digital forms, etc. This experience makes me really value all the effort that the science crew did for the deployment and recovery of the data that I am currently working on. For the future seismologists who are going to work with the data, I want to say that we did our best to make sure the seismometers were meticulously deployed and I am sure the recovery crew will be equally careful to collect the year-long log of wiggles from the stations deployed by the first and second legs. Good luck!

-Jefferson Yarce, University of Colorado

Onshore Deployment: Alaska Peninsula, Kodiak Island and Shumagin Islands; May-June 2018

>> 16 May, 2018 | A for Amphibious • The second A in AACSE stands for Amphibious – fully encompassing the entire subduction zone requires making measurements on land and at sea. The onshore part of the program involves installing instruments on Kodiak Island, the Shumagin Islands (southwest of Kodiak), the Alaska Peninsula and the region around Katmai National Park. These thirty instruments will be placed in remote locations (black circles on the map p.19) accessed by float planes or small fixed-wing planes. One team of three people is installing thirteen sites on Kodiak Island, and a second team is deploying the rest of the sites on the mainland and Shumagin Island. Today the Kodiak team started their first day of work! Like working at sea, the initial work involves unpacking all the gear shipped from across the country, and testing and assembling everything. To make sure everything is working properly, we do a “huddle test,” where we set up all of the seismometers and data loggers in one place and let them collect data for one day. We are fortunate to have been given access to some space in the Kodiak Alaska Fisheries Science Center, a research facility that provides valuable data to the fishing industry and that has a wonderful aquarium. This means we are sometimes sharing the space with sea life, like a large half-decomposed salmon shark! Tomorrow, if all goes well, we can start deploying!

– Geoff Abers, Cornell University

>> 21 May, 2018 | Kodiak Island • The road network on Kodiak Island is confined to the region around the town of Kodiak, so one must travel by boat or plane to reach other parts of this rugged and beautiful island. Eight of the thirteen seismic stations that we are installing here are both off the road system and far from towns with air strips, and we have been traveling to them by float plane. One limitation of using small planes for seismic installations is that there is a weight limit on what you can bring. The float plane we have been using, a de Havilland DHC-2 Beaver, can carry 1,200 lbs. Our field team and equipment for two stations weigh 1,175 lbs! We have to do a weigh-in before our first flight – fortunately they weighed our field team together and not individually. Flying also requires better weather than simply driving to a station. So far, we have found that the weather is worse on the eastern part of Kodiak near Kodiak town but improves to the west. We feel lucky to have had three days in a row where we could fly out to some of our sites. In the last three days, we have installed five stations that have taken us to many corners of Kodiak: McDonald lagoon on the southwestern coast, small Anvil Lake in far western Kodiak and the gorgeous Uyak Bay, a fjord that connects to the ocean in the north and cuts across two thirds of the island. This fjord is enabling us to deploy closely spaced stations over a part of the subduction zone fault where large earthquakes occur, one of the primary targets of this project. Traveling by plane across Kodiak is spectacular; you are treated to stunning views of snow-capped mountains and broad valleys. Sometimes you can see mountain goats lining steep slopes, bears meandering along the shore, and frolicking otters in the water. The views from our seismic sites are really amazing, too, when we look up from orienting sensors and plugging in data loggers. Six down, seven to go for the Kodiak team!

-Donna Shillington, Lamont-Doherty Earth Observatory

>> 30 May, 2018 | Challenging Conditions • The three members of the Sand Point team set sail on the Aleut Mistress to install two strong motion sites on Nagai Island. The day started with beautiful glassy-smooth seas and a calm two hour cruise to our first site on the north side of the island. We loaded our equipment into a skiff, hopped onboard and motored to our chosen landing site. This site was chosen by satellite imagery, and as always, conditions on the ground were a little different than expected. Our landing site was a bit marshy, and we had to lug the equipment uphill through marsh grasses and bushes, and then dig through a foot-thick mat of interwoven vegetation to find a suitably dry site for burial. Anything for good data! The equipment worked like a champ, so our time spent testing it in Sand Point paid off. We left the station after five hours of work – only two-and-a-half times longer than it has taken for any other station thus far! Back on the Aleut Mistress, our captain, Boomer, had boiled some Alaskan crab for our lunch. Hard to get it any fresher!

In the afternoon, the seas started picking up with swells a little over two fathoms (that’s a little over twelve feet for you land-lubbers). While none of our crew suffered from seasickness, there were some flying objects on deck and in the cabin! We hopped back in the skiff when we reached Nagai site #2, and headed toward shore. We got so close, but in the end the boat crew felt it was unsafe to land with the high seas and changing tide. Disappointed, we made the call to cancel the site. It is a hard decision to choose not to install a station. Fortunately, an excellent Plan B fell into our laps. As luck would have it, Boomer owns property near King Cove and offered his place as a home for our new station. So, a fairly tough first day in the field ended on a high note, with the formation of plans for the future. The next three days passed slowly, as our team waited on unanticipated repairs to the plane needed for other installations out of Sand Point. Everybody wants a well-maintained plane, so we waited patiently for the repairs and sorted through and retested equipment in Sand Point. By the time the plane was ready, our team was raring to hit the field again. We hammered out four more stations in just two days, and have nearly finished our work here in Sand Point.

-Aubreya Adams, Colgate University

Get involved

This project is intended to help grow the seismological community, and includes opportunities to sail on OBS cruises and short courses for undergraduates. Upcoming opportunities for 2019 will be announced in December on the project website.

Contact members of the PI team for more information. All seismic data from the project will be open to the community upon recovery and QA/QC efforts at the IRIS DMC (OBS array has network code XD (2018-2019) and land array has network code XO (2018-2019)). The first three months of onshore data is currently online. All underway data acquired by the Sikuliaq will be archived and available at the UNOLS rolling deck to repository server.

Check out the experiment blog for more stories from the field

Reference information

A continent-scale geodetic velocity field for East Africa. R. Bendick, M. Floyd, E. Lewi, G Kianji, R. King, E. Knappe
GeoPRISMS Newsletter, Issue No. 41, Fall 2018. Retrieved from http://geoprisms.nineplanetsllc.com

Spotlight | A continent-scale geodetic velocity field for East Africa


Rebecca Bendick1, Mike Floyd2, Elias Lewi3, Gladys Kianji4, Robert King2, El Knappe1

1University of Montana, 2MIT, 3Addis Ababa University, 4University of Nairobi

The East African Rift System is a complicated set of extensional structures reaching from Malawi in the south to Eritrea and Djibouti in the north (Fig. 1)(e.g. Ebinger, 2005). These structures are broadly interpreted as the expression of the ongoing breakup of the African continent into a “Somali” block moving east or northeastward relative to a “Nubia” block, with perhaps additional smaller blocks (e.g. Saria et al., 2014) also involved. The details of the kinematics, the presence or importance of entrained microplates, and even the components of the force balance exciting relative block motions and extensional strains are all the subject of ongoing research and incompletely resolved scientific debates.

Figure 1. Overview of the EARS, with shaded topography in gray, major faults in red, recorded seismicity of Mw>5 as blue circles, and generalized kinematic velocities from Saria et al. (2014).

Several decades of geophysical and geologic research have contributed a large body of observational data related to the timing (Bosworth, 1992; Bosworth and Strecker, 1997; George et al., 1998; Wichura et al., 2010), chemistry (Aulbach et al., 2008; Bianchini et al., 2014; Chesley et al., 1999; Kaeser et al., 2009; Pik et al., 2006), mechanics (Buck, 2004; Calais et al., 2008; Corti et al., 2003; Weinstein et al., 2017), kinematics (Birhanu et al., 2015; Calais et al., 2008; Modisi et al., 2000; Saria et al., 2014), mantle involvement (Adams et al., 2012; Bastow et al., 2005; Bastow et al., 2008; Chang and Van der Lee, 2011; Fishwick, 2010; Hansen and Nyblade, 2013), magmatism (Bastow et al., 2010; Kendall et al., 2005) and natural hazards (Ayele, 2017) of continental extension in Africa. However, most of these studies are focused on a single “segment” of the larger rift system, hence on a distinct structural unit. Some work has been done to compare segments as a means of exploring the relative importance of contributing factors, such as the availability of fluids in magma-rich and magma-poor segments (Bialas et al., 2010; Hayward and Ebinger, 1996; Roecker et al., 2017; Rooney et al., 2011), the influence of total finite strain (Ebinger, 2005) on rift morphology, or the importance of sublithospheric plume impingement on the force balance (Ebinger and Sleep, 1998; Lin et al., 2005; Nyblade and Robinson, 1994). However, fully synoptic studies for the whole East African Rift System (EARS) are few in number.

A GeoPRISMS-supported collaboration between MIT and the University of Montana targeted the development of a comprehensive, consistent geodetic surface velocity solution for the entire EARS focus area (Fig. 2). This effort included several components:

  1. Collection of all publically available raw GPS observations from East Africa from 1992 to 2015;
  2. Negotiation for the release and inclusion of several additional restricted GPS observation data sets from European and African sources;
  3. Compilation and verification of all related metadata;
  4. Systematic assessment and quality control on all available data sets; and
  5. Processing of the merged data sets with a consistent processing strategy and reference frame.

Figure 2. The most recent community geodetic solution, using all available raw data from the EARS region, processed using GAMIT/GLOBK with a consistent quality standard and editing approach, in a single common reference frame. This solution, data sources, and relevant metadata are available from the GeoPRISMS data portal at http://www.marine-geo.org with doi:10.1594/IEDA/321764

The supported work addresses the GeoPRISMS Rift Initiation and Evolution (RIE) goal of synthesis, especially in the context of multiscale mechanics and controls on deformation and localization of strain.

During the period of support for this experiment, we also leveraged the NSF funding to invest in permanent geodetic instrumentation in Ethiopia and add new observations in the Turkana Depression of Ethiopia and Kenya, the part of the EARS with the fewest prior geodetic observations. In the first case, we extended operations of a previously-funded Ethiopian Highlands continuous GPS network for an additional year. That year allowed Addis Ababa University and the University of Montana to negotiate with several different stakeholders in the U.S. and Africa, with the end result that the Institute of Geophysics, Space Science, and Astronomy of Addis Ababa University adopted a fully operational, scientific-grade geodetic network of ten sites for permanent ongoing observations (Fig. 3). The network became the largest entirely African owned and operated geophysical system, and maintains operations and a fully open data policy to the present. In the second case, we added an additional epoch of campaign observations on six campaign GPS sites (Fig. 4) and added two continuous GPS systems in the Turkana Depression (Fig. 5). The continuous sites are located on either side of Lake Turkana and are hosted by the Turkana Basin Institute, a nonprofit entity supporting research through the region.

The primary purposes of the project were scientific and infrastructural capacity-building. The synoptic geodetic velocity field is intended for use by a wide range of researchers in many different disciplines within the rifting initiative and the EARS focus area. Many users will likely leverage the kinematic framework as boundary conditions, a priori constraints, or tectonic context for more focused studies without having to address data collection, standardization, quality control, metadata management, or processing strategies. We hope that the solution will inform other work and serve as an example of the value of a community commitment to open sharing of high-quality observations. In addition, the successful adoption of the instrumental array by African scientists sets a precedent for negotiated transfers of other instruments and capabilities throughout the region. African researchers and institutions can and should use such combinations of infrastructure and technical skills to pursue their own novel scientific targets and build indigenous training capabilities. Finally, the new Turkana Basin continuous sites are approaching a full year of operation, and will begin to yield usable scientific constraints on the most enigmatic part of the EARS very soon. ■

References

Adams A., A. Nyblade, D. Weeraratne, (2012), Upper mantle shear wave velocity structure beneath the East African plateau: Evidence for a deep, plateau-wide low velocity anomaly. Geophys J Int, 189(4), 123–142.
Aulbach S., R. Rudnick, W. McDonough, (2008), Li-Sr-Nd isotope signatures of the plume and cratonic lithospheric mantle beneath the margin of the rifted Tanzanian craton (Labait). Contrib Mineral Petrol, 155(1), 79–92.
Ayele A., (2017), Probabilistic seismic hazard analysis (PSHA) for Ethiopia and the neighboring region. J Afr Earth Sci, 134, 257–264.
Bastow I., G. Stuart, J.-M. Kendall, C. Ebinger, (2005), Upper-mantle seismic structure in a region of incipient continental breakup: Northern Ethiopian rift. Geophys J Int, 162, 479–493. doi: 10.1111/j.1365246X.2005.02666.x.
Bastow I., A. Nyblade, G. Stuart, T. Rooney, M. Benoit, (2008), Upper mantle seismic structure beneath the Ethiopian hotspot: Rifting at the edge of the african low velocity anomaly. Geochem Geophys Geosyst, 9(12), Q12022. doi: 10.1029/2008GC002107.
Bastow I., S. Pilidou, J.-M. Kendall, G. Stuart, (2010), Melt-induced seismic anisotropy and magma assisted rifting in Ethiopia: Evidence from surface waves. Geochem Geophys Geosyst, 11, Q0AB05. doi: 10.1029/2010GC003036.
Bialas R., W. Buck, R. Qin, (2010), How much magma is required to rift a continent? Earth Planet Sci Lett, 292(1),68–78.
Bianchini G., J. Bryce, J. Blichert-Toft, L. Beccaluva, C. Natali, (2014), Mantle dynamics and secular variations beneath the East African Rift: Insights from peridotite xenoliths (Mega, Ethiopia). Chem Geol, 386, 49–58.
Bosworth W., (1992), Mesozoic and early Tertiary rift tectonics in East Africa. Tectonophysics, 209(1-4), 115–137.
Bosworth W., Strecker M., (1997), Stress field changes in the Afro–Arabian rift system during the Miocene to Recent period. Tectonophysics, 47–62.
Buck W., (2004), Consequences of asthenospheric variability on continental rifting. In: G. Karner, B Taylor, N.W. Driscoll, and D.L. Kohlstedt (Editors), Rheology and Deformation of the Lithosphere at Continental Margins, 1–30.
Calais E., d’Oreye N., Albaric J., Deschamps A., Delvaux D., Deverchere J., Ebinger C., Ferdinand R.W., Kervyn F., Macheyeki A.S., Oyen A., Perrot J., Saria E., Smets B., Stamps D.S., Wauthier C., (2008), Strain accommodation by slow slip and dyking in a youthful continental rift, East Africa. Nature, 456, 783-787.
Chang S., S. Van der Lee, (2011), Mantle plumes and associated flow beneath Arabia and East Africa. Earth Planet Sci Lett, 302(3), 448–454.
Chesley J., R. Rudnick, C. Lee, (1999), Re-Os systematics of mantle xenoliths from the East African Rift: Age, structure, and history of the Tanzanian craton. 63(7), 1203–1217.
Corti G., J. Van Wijk, M. Bonini, D. Sokoutis, S. Cloetingh, F. Innocenti, P. Manetti, (2003), Transition from continental break-up to punctiform sea floor spreading: how fast, symmetric and magmatic. Geophys Res Lett, 30(12). doi: 10.1029/2003GL017374.
Ebinger C., (2005), Continental break-up: the East African perspective. Astronomy and Geophysics, 46, 16–21.
Ebinger C., N. Sleep (1998), Cenozoic magmatism throughout East Africa resulting from impact of a single plume. Nature, 395, 788–791.
Fishwick S., (2010), Surface wave tomography:imaging of the Lithosphere-Asthenosphere Boundary beneath Central and Southern Africa? Lithos, 120(1-2), 63–73.
George R., N. Rogers, S. Kelley, (1998), Earliest magmatism in Ethiopia: Evidence for two mantle plumes in one continental flood basalt province. Geology, 26, 923–926.
Hansen S., A. Nyblade (2013), The deep seismic structure of the Ethiopia/Afar hotspot and the African superplume. Geophys J Int, 194(1), 118–124.
Hayward N., C. Ebinger, (1996), Variations in the along–axis segmentation of the Afar rift system. Tectonics, 15, 244–257.
Kaeser B., B. Olker, A. Kalt, R. Altherr, T. Pettke, (2009), Pyroxenite xenoliths from Marsabit (Northern Kenya): Evidence for different magmatic events in thelithospheric mantle and interaction between peridotite and pyroxenite. Contrib Mineral Petrol, 157(4), 453–472.
Kendall J.-M., G. Stuart, C. Ebinger, I. Bastow, D. Keir (2005), Magma assisted rifting in Ethiopia. Nature, 433, 146–148.
Lin S., B. Kuo, L. Chiao, P. van Keken, (2005), Thermal plume models and melt generation in East Africa: A dynamic modeling approach. Earth Planet Sci Lett, 237(1), 175–192.
Modisi M.P., E.A. Atekwana, A.B. Kampunzu, T.H. Ngwisanyi, (2000), Rift kinematics during the incipient stages of continental extension: Evidence from the nascent Okavango rift basin, northwest Botswana. Geology, 28(10), 939-942.
Nyblade A., S. Robinson, (1994), The African Superswell. Geophys Res Lett, 21(9), 765–768.
Pik R., B. Marty, D. Hilton (2006), How many mantle plumes in Africa? The geochemical point of view. Chem Geol, 226(3-4), 100–114.
Roecker S., C. Ebinger, C. Tiberi, G. Mulibo, R. Ferdinand-Wambura, K. Mtelela, G. Kianji, A. Muzuka, S. Gautier, J. Albaric, S. Peyrat, (2017), Subsurface images of the Eastern Rift, Africa, from the joint inversion of body waves, surface waves and gravity: Investigating the role of fluids in early-stage continental rifting. Geophys J Int, 210(2), 931–950.
Rooney T., I. Bastow, D. Keir, (2011), Insights into extensional processes during magma assisted rifting: Evidence from aligned scoria cones. J Volcanol Geotherm Res, 83–96, doi: 10.1016/j.jvolgeores.2010.07.019.
Saria E., E. Calais, D.S. Stamps, D. Delvaux, C.J.H. Hartnady, (2014), Present‐day kinematics of the East African Rift. J Geophys Res: Solid Earth, 119(4), 3584-3600.
Weinstein A. , S.J. Oliva, C.J. Ebinger, S. Roecker, C. Tiberi, M. Aman, C. Lambert, E. Witkin, J. Albaric, S. Gautier, S. Peyrat, J.D. Muirhead, A.N.N. Muzuka, G. Mulibo, G. Kianji, R. Ferdinand-Wambura, M. Msabi, A. Rodzianko, R. Hadfield, F. Illsley-Kemp, T. Fischer (2017), Fault-magma interactions during early continental rifting: Seismicity of the Magadi-Natron-Manyara basins, Afr Geochem Geophys Geosyst doi: 10.1002/2017GC007027.
Wichura H., R. Bousquet, R. Oberhansli, M.R. Strecker, M. Trauth (2010), Evidence for middle Miocene uplift of the East African Plateau. Geology, 38(6), 543–546.

Reference information

A continent-scale geodetic velocity field for East Africa. R. Bendick, M. Floyd, E. Lewi, G Kianji, R. King, E. Knappe
GeoPRISMS Newsletter, Issue No. 41, Fall 2018. Retrieved from http://geoprisms.nineplanetsllc.com

Spotlight | Constraining variability in mantle CO2 flux along the East African Rift System


James D. Muirhead1, Tobias P. Fischer2, Amani Laizer3, Sarah J. Oliva4, Emily J. Judd1, Hyunwoo Lee5, Emmanuel Kazimoto3, Gladys Kianji6, Cynthia J. Ebinger4, Zachary D. Sharp2, Josef Dufek7

1Syracuse University, 2University of New Mexico, 3University of Dar es Salaam, 4Tulane University, 5Seoul National University, 6University of Nairobi, 7University of Oregon

Figure 1. Annotated SRTM map showing the extent of the rift basins in the current study. Filled circles show the location of sampling regions within each basin, and the dashed brown line delineates the eastward-dipping surface boundary between the Tanzanian craton and Proterozoic mobile belt rocks (from the geological map of Thiéblemont et al. (2016)). Also included is the mean flux of magmatic CO2 from sampling sites in each basin. Inset in the top left shows the location of the DEM map on the African continent. Red lines show the extent of the Eastern (EB) and Western (WB) branches of the EARS.

In May and June 2018, our team of researchers completed the longest along-strike magmatic CO2 degassing survey in the East African Rift System (EARS) to date. Our CO2 flux data now extend over four rift basins, from the Magadi basin (Kenya) southward to the Balangida basin (Tanzania) (Fig. 1). During the 25-day field campaign, we collected over one thousand diffuse soil degassing flux measurements, and sampled hydrothermal spring systems along major fault zones to analyze the sources and fluxes of different volatile species. Here we present preliminary results of diffuse CO2 flux in zones within one hundred meters of observed spring discharge and use these values to examine variations in magmatic CO2 discharges between basins. The spatial variability of these data reveal how mantle CO2 fluxes in the EARS may evolve over the course of rift basin development, and are impacted by the initial composition and structure of the East African lithosphere.
Continental rifts are sites of lithospheric thinning and heating, which is commonly accompanied by magmatism and volatile transfer from Earth’s mantle to the lithosphere and atmosphere (White and McKenzie, 1989; Ebinger, 2005; Rooney, 2010; Lee et al., 2017; Foley and Fischer, 2017). They represent a key tectonic setting for natural CO2 emissions and possibly modulate Earth’s climate on geological timescales (Brune et al., 2017; Foley and Fischer, 2017). However, the total volume of mantle CO2 emitted at rift settings is poorly constrained, as are the mechanisms that control variations in CO2 flux over the lifetime of rifting.

The original carbon content of cratonic lithosphere is expected to be relatively low (~0.25 Mt C km–3 for 2-3 Ga lithosphere; Foley and Fischer, 2017). However, abundant carbon may be sequestered in the mantle lithosphere during the infiltration of both plume melts (e.g., Thompson et al., 2015) and carbon-rich hydrous-silicate melts generated during subduction (Foley and Fischer, 2017; Malusà et al., 2018).

These processes can potentially enrich carbon contents in the mantle lithosphere up to a hundred times above background values (Foley and Fischer, 2017). The resulting carbon accumulated during these events may be released during the generation and ascent of magma at continental rift settings (Malusà et al., 2018) (Fig. 2).

Although continental rifts represent potentially key sites of CO2 release, measuring the flux of CO2 from these settings is challenging and requires direct measurements and observations of CO2 discharge from zones of active rifting. The magma-rich Eastern branch of the East African Rift System (EARS) represents an ideal location to investigate these processes. Earlier degassing studies focused on direct measurements of volcanic plumes emitted from active volcanoes, such as Nyiragongo (Sawyer et al., 2008) and Oldoinyo Lengai (Brantley and Koepenick, 1995). In addition to these plume sources, EARS volcanoes release mantle volatiles to the atmosphere via springs, fumaroles, and zones of diffuse soil degassing, as well as during eruptive episodes (Darling et al., 1995; Fischer et al., 2009; Barry et al., 2013; de Moor et al., 2013; Hutchison et al., 2015; Lee et al., 2017). More recent studies in the EARS have shown that large volumes of mantle carbon are also released to the atmosphere along extensional fault systems situated away from volcanoes (Lee et al., 2016, 2017; Hunt et al., 2017). During this process, termed “tectonic degassing” (Burton et al., 2013; Lee et al., 2016), mantle carbon ascends to the surface along permeable fault zones and exits via springs, diffuse soil degassing zones, and gas vents (Muirhead et al., 2016; Lee et al., 2016, 2017; Hunt et al., 2017). This mantle carbon is primarily sourced from an enriched sub-continental lithospheric mantle and released into the crust and atmosphere by magmas emplaced at lower crustal depths (Lee et al., 2017; Roecker et al., 2017).

Figure 2. Production and transport of magmatic CO2 at continental rift settings modified from Hunt et al. (2017). White arrows represent zones of CO2 fluid flow, yellow stars are hydrothermal springs, and orange stars are deep earthquakes. The CO2 depicted exsolves from cooling upper and lower crustal magmas. The distribution of crustal magma (red polygons) is based on seismicity from Weinstein et al., (2017) and the seismic tomography model of Roecker et al. (2017).

Given the large aerial extent, pervasive faulting, and widespread magma emplacement occurring at depth in the EARS (e.g., Keranen et al., 2004; Roecker et al., 2017; Plasman et al., 2017), quantifying the volumes of CO2 released requires observations from a wide variety of structural settings along the rift system. Results of diffuse soil degassing surveys have thus far been reported from the northern and central Main Ethiopian Rift (Hunt et al., 2017) and Magadi-Natron basin (Lee et al., 2016), with estimates of 0.52-4.36 Mt yr-1 and 2.15-5.95 Mt yr-1 for each rift sector, respectively.

Extrapolation of these estimates point to potential CO2 fluxes on the order of 10-100 Mt yr-1, particularly when accounting for dissolved CO2 volumes transported in springs (Lee et al., 2017). However, these estimates do not consider the spatial and temporal variations of mantle CO2 discharge expected along any active rift system. The flux of CO2 within any rift basin should depend on a number of critical factors, such as the volume of carbon trapped within the underlying mantle lithosphere, rates of magma production, and the dissolved CO2 contents of ascending rift magmas (Foley and Fischer, 2017; Hunt et al., 2017). These variables are expected to vary both spatially and temporally within any continental rift setting, and quantifying their importance for mantle CO2 release requires extensive along-strike sampling of zones of volatile discharge.

Our recent field campaign was specifically designed to fill in these critical gaps in our understanding of rift CO2 fluxes, through an investigation of four segments of the Eastern branch of the EARS: the Magadi, Natron, Manyara, and Balangida basins (Fig. 1). These basins encompass a ~350 km-long stretch of continental rifting and range in age between 1 and 7 Ma, and are thus currently at different stages of development. Furthermore, these basins exhibit varying volcanic/magmatic fluxes and histories, and even cross the boundary between Proterozoic mobile belt rocks and the Archean Tanzania Craton (Fig. 1). Therefore, from these data we can assess:

  1. How mantle CO2 fluxes may evolve over the course of basin development; and
  2. How CO2 fluxes are impacted by the initial lithospheric composition and structure of the East African lithosphere.

Given the inherent variability of CO2 flux within individual rift basins (e.g., Hunt et al., 2017), when comparing CO2 discharges between basins it is critical to compare data from sites exhibiting similar structure, substrate, and hydrology. Therefore, we present here a subset of our collected data, focusing specifically on flux data (1) from rift-graben sediments, (2) in the vicinity of faults, and (3) in areas within 100 m of observed spring discharge.

The sources for diffuse soil CO2 discharges in volcano-tectonic settings are typically characterized as either biogenic or magmatic, with flux data in each population exhibiting a log-normal distribution and the highest mean flux observed in the magmatic population (e.g., Chiodini et al., 1998, 2008). Data from each study site, presented as probability plots in Figure 3, were sub-divided into two distinct populations by adapting the methodology of Sinclair (1974) into a newly designed MATLAB® code. This code iteratively fits biogenic and magmatic regression lines to the log-transformed data. Based on these functions, synthetic data sets are generated for each population and plotted against observed data, with the final solution being that which produces the highest R-squared and smallest root-mean-squared error values between the compared datasets. Outputs from this procedure provide an estimate of the percent contribution of biogenic and magmatic sources and their mean flux values.

Figure 3. Probability plots of diffuse soil CO2 fluxes for each rift basin in the study. Note that the overall CO2 flux values decrease from north (Magadi) to south (Balangida). Flux values below the equipment detection limit (<0.24 g m-2 d-1) cannot be presented on the plots, but still affect the probability distribution of flux values above the detection limit.

Comparing data between basins, we observe a north to south decrease in both the percent contribution of the magmatic flux population and the mean magmatic flux value (see mean flux values in Figure 1). Lower magmatic CO2 flux values also correspond with younger rift basins (e.g., the Manyara and Balangida basins). These younger basins also exhibit lower volcanic/magmatic inputs (Le Gall et al., 2008; Albaric et al., 2014), which may relate to the low degree stretching and related decompression melting during this earlier stage of rifting, or to the relatively dry nature of thick Archean mantle that enables its preservation (e.g., Currie and van Wijk, 2016). Finally, as the locus of rifting gradually transitions from the Proterozoic mobile belt in the Natron basin, to the Tanzanian craton in the Balangida basin, we observe a significant reduction in the mean magmatic CO2 flux.

These preliminary results suggest that the volume of mantle CO2 discharge in the Eastern branch of the EARS is strongly dependent on the degree of lithospheric thinning, mantle hydration state, and related magmatism. The greatest mantle CO2 discharges in the EARS likely occur in more evolved systems outside the Archaean craton, such as the Kenya Rift (Lee et al., 2016) and Main Ethiopian Rift (Hunt et al., 2017). Furthermore, basins in their earliest rift stages (the ~1 Ma Manyara and Balangida basins) within Proterozoic mobile belt rocks exhibit higher CO2 fluxes than those in the Archean craton. This observation suggests that the Proterozoic lithosphere in East Africa may contain greater volumes of sequestered carbon, with its structure and composition suited for volumetrically significant CO2 discharges compared to the thick and probably dehydrated cratonic lithosphere. ■

References

Albaric, J., J. Deverchere, J. Perrot, A. Jakovlev, A. Deschamps, ( 2014), Deep crustal earthquakes in North Tanzania, East Africa: Interplay between tectonic and magmatic processes in an incipient rift. Geochem Geophys Geosys 15, 374-394.
Barry, P.H., D.R. Hilton, T.P. Fischer, J.M. de Moor, F. Mangasini, C. Ramirez, (2013), Helium and carbon isotope systematics of cold “mazuku” CO2 vents and hydrothermal gases and fluids from Rungwe Volcanic Province, southern Tanzania. Chem Geol, 339, 141-156.
Brantley, S.L., K.W. Koepenick, (1995), Measured carbon dioxide emissions from Oldoinyo Lengai and the skewed distribution of passive volcanic fluxes. Geology, 23, 933-936.
Brune, S., S.E. Williams, R.D. Müller, (2017), Potential links between continental rifting, CO2 degassing and climate change through time. Nat Geosci, 10, 941.
Burton, M.R., G.M. Sawyer, D. Granieri, (2013), Deep Carbon Emissions from Volcanoes. Carbon in Earth, 75, 323-354.
Chiodini, G., R. Cioni, M. Guidi, B. Raco, L. Marini, (1998), Soil CO2 flux measurements in volcanic and geothermal areas. Appl Geochem, 13, 543-552.
Chiodini, G., S. Caliro, C. Cardellini, R. Avino, D. Granieri, A. Schmidt, (2008), Carbon isotopic composition of soil CO2 efflux, a powerful method to discriminate different sources feeding soil CO2 degassing in volcanic-hydrothermal areas. Earth Planet Sci Lett, 274, 372-379.
Currie, C.A., J. van Wijk, (2016), How craton margins are preserved: Insights from geodynamic models. J Geodyn, 100, 144-158.
Darling, W.G., E. Griesshaber, J.N. Andrews, H. Armannsson, R.K. O’Nions, (1995), The origin of hydrothermal and other gases in the Kenya Rift Valley. Geochim Cosmochim Acta, 59, 2501-2512.
de Moor, J.M., T.P. Fischer, Z.D. Sharp, D.R. Hilton, P.H. Barry, F. Mangasini, and C. Ramirez, (2013), Gas chemistry and nitrogen isotope compositions of cold mantle gases from Rungwe Volcanic Province, southern Tanzania. Chem Geol, 339, 30-42.
Ebinger, C., (2005), Continental break-up: The East African perspective. Astronomy & Geophysics, 46, 16-21.
Fischer, T.P., P. Burnard, B. Marty, D.R. Hilton, E. Furi, F. Palhol, Z.D. Sharp, and F. Mangasini, (2009), Upper-mantle volatile chemistry at Oldoinyo Lengai volcano and the origin of carbonatites. Nature, 459, 77-80.
Foley, S.F., T.P. Fischer, (2017), An essential role for continental rifts and lithosphere in the deep carbon cycle. Nat Geosci, 10, 897.
Hunt, J.A., A. Zafu, T.A. Mather, D.M. Pyle, P.H. Barry, (2017), Spatially Variable CO2 Degassing in the Main Ethiopian Rift: implications for magma storage, volatile transport, and rift‐related emissions. Geochem, Geophys Geosys, 18, 3714-3737.
Hutchison, W., T.A. Mather, D.M. Pyle, J. Biggs, G. Yirgu, (2015), Structural controls on fluid pathways in an active rift system: A case study of the Aluto volcanic complex. Geosphere, 11, 542-562.
Keranen, K., S.L. Klemperer, R. Gloaguen, E.W. Group, (2004), Three-dimensional seismic imaging of a protoridge axis in the Main Ethiopian rift. Geology, 32, 949-952.
Le Gall, B., P. Nonnotte, J. Rolet, M. Benoit, H. Guillou, M. Mousseau-Nonnotte, J. Albaric, J. Deverchere, (2008), Rift propagation at craton margin. Distribution of faulting and volcanism in the North Tanzanian Divergence (East Africa) during Neogene times. Tectonophysics, 448, 1-19.
Lee, H., J.D. Muirhead, T.P. Fischer, C.J. Ebinger, S.A. Kattenhorn, Z.D. Sharp, G. Kianji, (2016), Massive and prolonged deep carbon emissions associated with continental rifting. Nat Geosci, 9, doi. 10.1038/NGEO2622.
Lee, H., T.P. Fischer, J.D. Muirhead, C.J. Ebinger, S.A. Kattenhorn, Z.D. Sharp, G. Kianji, N. Takahata, Y. Sano, (2017), Incipient rifting accompanied by the release of subcontinental lithospheric mantle volatiles in the Magadi and Natron basin, East Africa. J Volcanol Geotherm Res, 346, 118-133.
Malusà, M.G., M.L. Frezzotti, S. Ferrando, E. Brandmayr, F. Romanelli, G.F. Panza, (2018), Active carbon sequestration in the Alpine mantle wedge and implications for long-term climate trends. Scientific reports, 8, 4740.
Muirhead, J.D., S.A. Kattenhorn, H. Lee, S. Mana, B.D. Turrin, T.P. Fischer, G. Kianji, E. Dindi, D.S. Stamps, (2016), Evolution of upper crustal faulting assisted by magmatic volatile release during early-stage continental rift development in the East African Rift. Geosphere, 12, 1670-1700.
Plasman, M., C. Tiberi, C. Ebinger, S. Gautier, J. Albaric, S. Peyrat, … & F. Wambura, (2017), Lithospheric low-velocity zones associated with a magmatic segment of the Tanzanian Rift, East Africa. Geophys J Int, 210, 465-481.
Roecker, S., C. Ebinger, C. Tiberi, G. Mulibo, R. Ferdinand-Wambura, K. Mtelela, K., … & Peyrat, S., (2017), Subsurface images of the Eastern Rift, Africa, from the joint inversion of body waves, surface waves and gravity: investigating the role of fluids in early-stage continental rifting. Geophys J Int, 210, 931-950.
Rooney, T.O., (2010), Geochemical evidence of lithospheric thinning in the southern Main Ethiopian Rift. Lithos, 117, 33-48.
Sawyer, G.M., S.A. Carn, V.I. Tsanev, C. Oppenheimer, M. Burton, (2008), Investigation into magma degassing at Nyiragongo volcano, Democratic Republic of the Congo. Geochem Geophys Geosys, 9.
Sinclair, A.J., (1974), Selection of threshold values in geochemical data using probability graphs. J Geochem Explor, 3, 129-149.
Thiéblemont, D., J-P. Liégeois, M. Fernandez-Alonso, A. Ouabadi, B. Le Gall, R. Maury, M. Jalludin, M. Vidal, C. Ouattara Gbélé, R. Tchaméni, A. Michard, P. Nehlig, P. Rossi, (2016), Geological Map of Africa: French Geological Survey (BRGM), scale 1:10 000 000.
Thompson, D.A., J.O. Hammond, J.M. Kendall, G.W. Stuart, G.R. Helffrich, D. Keir, A. Ayele, B. Goitom, (2015), Hydrous upwelling across the mantle transition zone beneath the Afar Triple Junction. Geochem Geophys Geosys, 16(3), 834-846.
Weinstein, A., S.J. Oliva, C.J. Ebinger, S. Roecker, C. Tiberi, M. Aman, … S. Peyrat, (2017), Fault‐magma interactions during early continental rifting: Seismicity of the Magadi‐Natron‐Manyara basins, Africa. Geochem Geophys Geosys, 18, 3662-3686.
White, R., D. McKenzie, (1989), Magmatism at rift zones: The generation of volcanic continental margins and flood basalts. J Geophys Res -Solid Earth, 94, 7685-7729.

Reference information

Constraining variability in mantle CO2 flux along the East African Rift System. J.D. Muirhead, T.P. Fischer, A. Laizer, S.J. Oliva, E.J. Judd, H. Lee, E. Kazimoto, G. Kianji, C.J. Ebinger, Z.D. Sharp, J. Dufek
GeoPRISMS Newsletter, Issue No. 41, Fall 2018. Retrieved from http://geoprisms.nineplanetsllc.com

SISIE: South Island Subduction Initiation Experiment


Erin Hightower (Caltech) and Brandon Shuck (UT Austin)

The South Island Subduction Initiation Experiment (SISIE) was an international collaborative active-source seismic survey of the Puysegur subduction margin conducted aboard the R/V Marcus G. Langseth with researchers and graduate students from Caltech, the University of Texas, Texas A&M University, Victoria University of Wellington, and the University of Otago, NZ. The SISIE hopes to further our understanding of the processes controlling subduction initiation, which remains one of the last unsolved problems in plate tectonics. There are many existing hypotheses and models that attempt to quantify and understand these processes, but while many of them are plausible, our ideas far outrun our data. Geodynamic modeling of subduction initiation can only go so far in accurately explaining the mechanics and dynamics of the process. Therefore, without sufficient data to substantiate these models, there is no definitive answer to how subduction zones form.
The Puysegur Trench is part of the Pacific-Australian plate boundary and is a uniquely situated margin for such a survey because it is a young subduction zone with a well-constrained kinematic history that currently appears to be making the transition from a forced to a self-sustaining state, a development that is crucial in ensuring the longevity of a subduction system. The SISIE project aims to test this hypothesis with the marine geophysical data we recently collected. We will use these data to model the crustal structure across the margin, which will play an important role in constraining geodynamic models of subduction initiation.

The SISIE took place from mid-February to late March, 2018 and acquired high-quality geophysical data along and around the Puysegur-Fiordland plate boundary (Fig. 1). As we quickly learned, a research cruise in the Southern Ocean is no easy feat, and twice we had to take shelter from storms and relentless ten-plus meter swells behind Auckland and Stewart islands. We were able to collect multichannel seismic reflection, wide-angle seismic refraction, high-frequency chirp, multibeam bathymetry, magnetic, and gravity data across the margin. Students onboard participated in a daily Marine Geophysics Class, taught by the PIs, which familiarized us with the various data types we were collecting and the tectonic history of New Zealand. By combining theoretical lectures with hands-on applications, the class gave us practical skills in processing and analyzing multibeam and seismic data, which was an invaluable experience.

A total of 28 UTIG ocean-bottom seismometers (OBSs) were deployed on two key transects which span from the subducting Australian plate, across the Puysegur trench and ridge, over the Solander Basin, and onto the Campbell Plateau (Fig. 1). Students were involved with all OBS operations including programming, sealing and mounting, deployment, and recovery of the instruments (Fig. 2). The OBS records show coherent arrivals of crustal and mantle refractions and Moho reflections, and hints of reflections from the subduction interface. These data will help constrain the crustal thickness and seismic velocity structure across the margin, which will help guide gravity modeling.

Multichannel seismic (MCS) data were acquired with a 4 or 12 km long streamer, with channels spaced every 12.5 m, and recording airgun shots every 50 m. A standard processing sequence of trace editing, noise suppression, deconvolution, velocity analysis, mute, stacking, post-stack time migration, and multiple suppression was applied, with many of these steps performed as the data were coming in. The resulting subsurface images are of excellent quality, which will allow us to constrain the nature and geometry of the incoming oceanic plate, subduction interface, upper plate faulting, and stratigraphy of the Solander Basin (Fig. 3).

New multibeam bathymetry data provide high-resolution characterization of seafloor features and topography. Gravity and magnetic data obtained throughout the duration of the cruise will also help provide constraints on crustal densities and structure, and detailed estimates of plate ages and their thermal and kinematic histories, supplementing previous datasets for the region. The gravity data in particular will be integrated with the structural surfaces interpreted from the MCS lines and tomography models to develop a comprehensive view of crustal structure that will shed light on the isostatic state of the Puysegur margin and ridge.

The SISIE onshore seismic array was deployed by a small team comprising students from Victoria University of Wellington, GNS Science researchers, and an American student volunteer. The seismographs consisted of five broadbands and 37 short-period instruments deployed in Fiordland and Southland (Fig. 1). The short period array comprises two approximately north-south profiles and one east-west profile across the Winston and Waiau basins, which were designed to line up with several of the MCS lines shot by the Langseth offshore to provide continuous onshore-offshore coverage. The broadbands on the offshore Islands and in those deployed onshore in Fiordland will remain in the field for a year to record earthquakes, a number of which have already been recorded from the Fiordland area. With this array, we hope to record data that elucidates the nature of the crust and the plate geometry beneath southern New Zealand.

The SISIE MCS images are the highest quality data collected in the region, which gives an unprecedented view of the Puysegur subduction zone. In the marine seismic reflection images, we can identify a clear décollement extending from the trench. The image shows some sediment being subducting with the downgoing oceanic plate and some being underplated onto the Pacific plate (Fig. 3a). We were surprised to find stretched continental crust beneath the Solander Basin with the possibility of serpentinized upper mantle (Fig. 3b). Although more work is needed to determine the connection between this stretched crust and the Puysegur subduction system, this is already a major result that likely has great implications for understanding the mechanisms behind subduction initiation. In fact, our preliminary results leave almost no real example of ocean-ocean subduction globally, implying that some component of buoyant continental crust may be necessary for subduction initiation. In the future, we will integrate these data into a more complex and robust geodynamic model of subduction zone formation. SISIE highlights the need to continue marine seismic surveys of subduction margins, especially in areas that are not well explored, and the scientific impact that they bring to our community. Stay tuned for upcoming exciting results from the SISIE researchers and students! ■

References

Mitchell et al, (2012), Undersea New Zealand, 1:5,000,000. NIWA Chart, Miscellaneous Series No. 92.

Reference information
SISIE: South Island Subduction Initiation Experiment 
GeoPRISMS Newsletter, Issue No. 40, Spring 2018. Retrieved from http://geoprisms.nineplanetsllc.com

Assessing changes in the state of a magma storage system over caldera-forming eruption cycles, a case study at Taupo Volcanic Zone, New Zealand


Kari Cooper (UC Davis), Adam Kent (Oregon State University), Chad Deering (Michigan Tech), and collaborator Darren Gravley (University of Canterbury, New Zealand)

The largest volcanic eruptions are rare events but when they occur can represent a global catastrophe. Relatively small eruptions may still have significant economic impacts (billions of dollars) and may affect the lives and livelihoods of large numbers of people – even in places quite distant from the erupting volcano (e.g., the relatively small Eyjafjallajokull eruption in Iceland in 2010). In an effort to study the processes that lead to large volcanic eruptions in more detail this project focuses on examining the highly active Taupo Volcanic Zone (TVZ) in New Zealand. Our goal is to develop a better understanding of how the temperature and mobility of a magma body below the surface changes before, during, and after a major eruption. As such the project contributes to an emerging understanding of the volcanoes and magmatic processes that can produce such large eruptions, and provides context for interpretation of hazard monitoring at these and other active volcanoes. The project also includes research experience for two K-12 teachers (one in the US and one in New Zealand), and will lead to development of new standard-based physics, chemistry and mathematics curricula.

Our approach is primarily a petrological and geochemical one and will focus on studying full caldera cycles – in addition to studying large eruptions themselves we will also focus on the smaller eruptions that occur before and after major episodes. We will couple age data with compositional data for both crystalline (plagioclase and zircon) and liquid (melt inclusions) parts of the erupted magma at the TVZ to develop constraints on the compositional and thermal variations within magma storage zones prior to eruptions. The project is at an early stage, but we have already compiled preliminary data and conducted a comprehensive sampling campaign during field work in December 2017. The field work was highly successful, bringing together PIs and graduate students from the three US institutions (UC Davis, OSU, and Michigan Tech) with our collaborator at University of Canterbury, along with K-12 science teachers Sara Moilanen (Houghton, MI) and Damien Canney (Christchurch, NZ). Field work also blended sample collection with filming videos of how we conduct field work and brief explanations of volcanic deposits and phenomena, which will be used to develop K-12 course content. The six graduate students in the group (Tyler Schlieder and Elizabeth Grant, UCD; Jordan Lubbers and Nicole Rocco, OSU; Olivia Barbee, MTU; and Lydia Harmon, Vanderbilt Univ.) also maintained a blog on the daily activities of the crew, and participated in the educational videos. The field work also set the stage for monthly video conferences among the graduate students, which helps to maintain coordination between individual thesis projects and the project as a whole.

Moving forward, we will collect a suite of data that will provide the foundation for a novel approach using two primary lines of investigation:

  1. Constraints on the thermal history of pre-eruptive magma storage by coupling absolute ages for plagioclase crystal populations derived from U-series measurements with trace element diffusion models to constrain the maximum residence time of crystals at a given temperature; and
  2. Quantification of the compositional heterogeneity of crystals and melt components, through in-situ measurements of trace-element and isotopic compositions in primary and accessory minerals and in melt inclusions (δ18O in zircon, εHf in zircon; Pb isotopes in plagioclase and melt inclusions), which will provide a measure of the degree to which the magma system is mixed across time and space within the reservoir as well as variations in the contributions of mantle and crustal sources to this reservoir.
  3. The unique strength of this approach is that it will allow simultaneous characterization of the thermal, compositional, and physical evolution of these silicic reservoirs. Therefore, the results of this study should be broadly relevant to other silicic volcanic systems and will represent an important step forward in improving our ability to interpret volcano monitoring data. Large silicic systems represent an end-member for volcanic activity globally, and more general models of the controls on the thermal conditions of magma storage beneath volcanoes will be developed by linking the results of this study with those from other ongoing projects. ■
Reference information
Assessing changes in the state of a magma storage system over caldera-forming eruption cycles, a case study at Taupo Volcanic Zone, New Zealand 
GeoPRISMS Newsletter, Issue No. 40, Spring 2018. Retrieved from http://geoprisms.nineplanetsllc.com

Sizing up the Taniwha: Seismogenesis at Hikurangi Integrated Research Experiment (SHIRE)


Jeff Marshall (Cal Poly Pomona) andJessica Pilarczyk (University of Southern Mississippi)

“A Live Dragon” Beneath the Sea

In Māori culture, the Taniwha is a dragon-like beast that lives beneath the water, sometimes protecting seafarers, while at other times wreaking disaster on coastal communities (King, 2007). Māori lore tells of Taniwha that cause sudden upheavals and changes in the coastline, altering the shape of the land-ocean interface. In the wake of New Zealand’s 2016 Mw7.8 Kaikōura Earthquake, the Taniwha was evoked as a supernatural force behind coastal uplift, tsunami, and landslides (Morton, 2018). For New Zealand, the Hikurangi subduction margin is a formidable Taniwha, a “live dragon” lurking just offshore, ready to unleash powerful forces locked within its seismogenic zone. With multiple collaborative research efforts now underway, geoscientists are shedding light on the habits of this secretive dragon, revealing new understandings of the earthquake and tsunami hazards that threaten New Zealand’s coastline.

The SHIRE Project

The Hikurangi margin along the east coast of New Zealand’s North Island (Fig. 1) provides an optimal venue for investigating megathrust behavior and controls on seismogenesis (e.g., Wallace et al., 2009 and 2014). Along-strike variations in multiple subduction parameters, such as interface coupling, fluid flow, and seafloor roughness, can be linked to observed differences in megathrust slip behavior (seismic vs. aseismic), forearc mass flux (accretion vs. erosion), and upper-plate deformation (contraction vs. extension). Much of the forearc is subaerial and therefore ideal for geodetic and geologic studies, while the submarine areas are easily accessible for geophysical imaging and monitoring. The SHIRE Project, funded by the NSF Integrated Earth Systems (IES) Program, is a four-year, multi-disciplinary, amphibious research effort involving a team of investigators at five US institutions, as well as multiple international collaborators from New Zealand, Japan, and the United Kingdom. This project is designed to evaluate system-level controls on subduction thrust behavior by combining both on and offshore active-source seismic imaging, with onshore paleoseismic, geomorphic, and geodetic investigations. The project results will be meshed with existing geophysical and geological datasets, and analyzed through the lens of state-of-the-art numerical modelling. The overarching goal is to develop an integrated perspective of the physical mechanisms controlling subduction thrust behavior and convergent margin tectonic evolution. Importantly, this perspective will help to elucidate a clearer picture of megathrust earthquake and tsunami hazards along New Zealand’s Hikurangi margin.

The SHIRE Project has three principal components:

Geophysical imaging: Harm van Avendonk (UT Austin) and David Okaya (Univ. of Southern California) are leading the shoreline-crossing geophysical imaging investigations. Marine seismic multi-channel reflection data (MCS) and seismic refraction data recorded by ocean-bottom seismometers (OBSs) are being used to characterize the incoming Hikurangi Plateau, map the structure of the offshore accretionary prism, and document subducted sediment variations. Onshore recordings of offshore airgun shots, explosive shots, and local earthquakes will determine the structure of the upper plate and properties of the deeper plate boundary zone.

Paleoseismology and morphotectonics: Paleoseismic and geomorphic studies led by Jeff Marshall (Cal Poly Pomona) and Jessica Pilarczyk (Univ. of Southern Mississippi) will collect new field data to supplement ongoing coastal tectonics investigations conducted by collaborators at New Zealand’s GNS Science. This integrated data set will help resolve megathrust slip behavior over several seismic cycles, and constrain long-term coastal uplift and subsidence patterns. This component of the project includes a Research Experience for Undergraduates (REU) program, supervised by Marshall, that engages US students in collaborative New Zealand fieldwork.

Numerical Modelling: Demian Saffer (Penn State) and Laura Wallace (UT and GNS Science) will coordinate the integration and analysis of project data through numerical modeling conducted by a team of U.S. and international investigators. The geophysical and geological results will be combined with a range of existing data sets from other projects to constrain numerical models of the physical state of the interface and evolution of the margin over both long and short (seismic cycle) timescales. Model results will also quantify linkages between in situ conditions, fluid flow, behavior of the subduction thrust, and subduction margin development.

SHIRE Spotlight: Geomorphic & Paleoseismic Studies

The SHIRE Project’s onshore geomorphic and paleoseismic fieldwork is investigating seismic cycle deformation in the coastal fore arc, focusing on geologic records of land level changes produced by episodes of tectonic uplift and subsidence. Jeff Marshall, Jessica Pilarczyk, and their students are targeting field sites along the North Island east coast (Fig. 2) that compliment ongoing investigations by GNS collaborators Nicola Litchfield, Kate Clark, and Ursula Cochran (e.g., Litchfield et al., 2016; Clark et al., 2015; Cochran et al., 2006). During field seasons in 2017 and 2018, the two research teams conducted parallel studies, with Marshall focused on marine terrace records of coastal uplift, and Pilarczyk on marsh stratigraphic records of subsidence and tsunami.

Marshall and students (Fig. 3A-F) are mapping, surveying, and sampling uplifted paleo-shorelines and marine terraces to identify past earthquakes, and to evaluate net coastal uplift patterns. Their efforts focus on several key locations along the Hikurangi margin, including the Raukumaura Peninsula, southern Hawkes Bay, and central Wairarapa coast. Coseismic uplift events are preserved along much of the Hikurangi coastline as elevated paleo-shore platforms and abandoned beach ridges. Marine shells collected from uplifted platforms and overlying beach sediments provide radiocarbon age constraints on prehistoric earthquakes. In addition to localized fieldwork, the Cal Poly Pomona team is using recently acquired airborne LiDAR imagery (provided by GNS) to correlate uplifted paleo-shorelines between field sites (both from this project and prior studies). The LiDAR data incorporates detailed altitude information, which can be used to track lateral variations in terrace uplift along the coast. Marshall and students are also mapping and sampling flights of uplifted Pleistocene marine terraces along the coast to evaluate longer-term fore arc uplift rates and deformation patterns.

Terrace cover beds have been sampled for optically stimulated luminescence (OSL) geochronology, and for the identification of volcanic tephra and loess deposits of known ages. During the next two years, terrace mapping and sampling will be expanded to new areas and drone imagery will be recorded for structure-from-motion studies. Project students will conduct digital terrain analyses using regional topographic data to evaluate net deformation patterns, calculate morphometric indices, and outline morphotectonic domains. Overall, the efforts of the coastal uplift team will provide new constraints on the timing and spatial distribution of both short-term seismic cycle events, as well as longer-term cumulative deformation.

Pilarczyk and students (Fig. 3 G-I) are using coastal sediments to develop long-term records of Hikurangi earthquakes and tsunamis. Microfossils such as foraminifera are used to recognize both subtle and abrupt changes in sea level along a coastline. An abrupt change in sea level, caused by coseismic subsidence, indicates the occurrence of an earthquake and can be recognized along the coastline as a soil buried beneath subtidal sediments. Because certain microfossils have fidelity to the tidal frame, they can be used to assess how much a coastline subsided during an earthquake. They can also be used to identify tsunami deposits because they indicate transport of marine sediment into a coastal setting where such sediment does not occur naturally. In this way, radiocarbon dating and microfossil analysis on coastal sediments can be used to understand the timing and magnitude of past Hikurangi earthquakes and tsunamis. In 2017 and 2018, Pilarczyk and students embarked on a sediment coring campaign that targeted low-energy depositional centers (i.e., marshes, lagoons) along the Hawke’s Bay coastline. Their mission was to find evidence for past Hikurangi earthquakes that would supplement the short-term observational record by expanding the age range of known events to include centennial and millennial timescales. The team’s ongoing investigations have led to the identification of newly discovered events that will help to better understand the seismic hazard for coastlines facing the Hikurangi margin. ■

References

Clark, K.J., B.W. Hayward, U.A. Cochran, L.M. Wallace, W.L. Power, A.T. Sabaa, (2015), Evidence for past subduction earthquakes at a plate boundary with widespread upper plate faulting: Southern Hikurangi Margin, New Zealand. Bull. Seismol. Soc. Am., 105. doi: 10.1785/0120140291
Cochran, U., K. Berryman, J. Zachariasen, D. Mildenhall, B. Hayward, K. Southall, C. Hollis, P. Barker, L.M. Wallace, B. Alloway, K. Wilson, (2006), Paleoecological insights into subduction zone earthquake occurrence, eastern North Island, New Zealand. Geol Soc Am Bull, 118, 1051-1074, doi:10.1130/B25761.1
Hayward, B.W., H.R. Grenfell, A.T. Sabaa, U.A. Cochran, K.J. Clark, L.M. Wallace, A.S. Palmer, A.S., (2016), Salt-marsh foraminiferal record of 10 large Holocene (last 7500 yr) earthquakes on a subducting plate margin, Hawkes Bay, New Zealand: Geological Society of America Bulletin, v.128, p. 896-915, doi:10.1130/B31295.1
King, D.N.T., J. Goff, A. Skipper, (2007), Māori environmental knowledge and natural hazards in Aotearoa-New Zealand. Journal of the Royal Society of New Zealand, 37, 59-73, doi.org/10.1080/03014220709510536.
Litchfield, N.J., U.A. Cochran, K.R. Berryman, K.J. Clark, B.G. McFadgen, R. Steele, (2016), Gisborne seismic and tsunami hazard: Constraints from marine terraces at Puatai Beach GNS Science Report 2016-21, 99
Morton, J., (2018), Our sleeping Taniwha: Hikurangi’s tsunami threat. New Zealand Herald, 10 March 2018, https://www.nzherald.co.nz
Wallace, L.M., M. Reyners, U. Cochran, S. Bannister, P.M. Barnes, K. Berryman, G. Downes, D. Eberhart-Phillips, A. Fagereng, S. Ellis, A. Nicol, R. McCaffrey, R.J. Beavan, S. Henrys, R. Sutherland, D.H.N. Barker, N. Litchfield, J. Townend, R. Robinson, R. Bell, K. Wilson, W. Power, (2009), Characterizing the seismogenic zone of a major plate boundary subduction thrust: Hikurangi Margin, New Zealand. Geochem Geophys Geosyst, 10, Q10006. doi:10010.11029/12009GC002610
Wallace, L.M., U.A. Cochran, W.L. Power, K.J. Clark, (2014), Earthquake and tsunami potential of the Hikurangi subduction thrust, New Zealand insight from paleoseismology, GPS, and tsunami modelling. Oceanography, 27, 104-117. doi:10.5670/oceanog.2014.46

Reference information
Sizing up the Taniwha: Seismogenesis at Hikurangi Integrated Research Experiment (SHIRE)
GeoPRISMS Newsletter, Issue No. 40, Spring 2018. Retrieved from http://geoprisms.nineplanetsllc.com