REPORT: GeoPRISMS-EarthScope Planning Workshop for Alaska – an SCD Primary Site


Portland, OR, September 22-24, 2011

Jeff Freymueller1, Peter Haeussler2, John Jaeger3, Donna Shillington4, Cliff Thurber5, Gene Yogodzinski6

1University of Alaska-Fairbanks; 2USGS, Anchorage; 3University of Florida; 4Lamont-Doherty Earth Observatory; 5University of Wisconsin-Madison; 6University of South Carolina

A jointly-sponsored GeoPRISMS-EarthScope Planning Workshop for the GeoPRISMS Alaska Primary Site was held in Portland, OR from September 22-24, with some additional support from the U.S. Geological Survey. There were approximately 140 participants, representing more than 60 U.S. academic institutions, as well as key geoscience stakeholders in Alaska, including the USGS, Alaska Volcano Observatory (AVO), Alaska Earthquake Information Center (AEIC, the regional seismic network), and other potential GeoPRISMS partners. International organizations in Germany, Russia, Japan and Canada were also represented. The group included 22 graduate students and post-docs who took part in a one-day pre-workshop Student Symposium. Lively and substantive discussions took place both in breakout and plenary sessions over the 2.5 day workshop, leading to a clear consensus plan for GeoPRISMS science in Alaska.
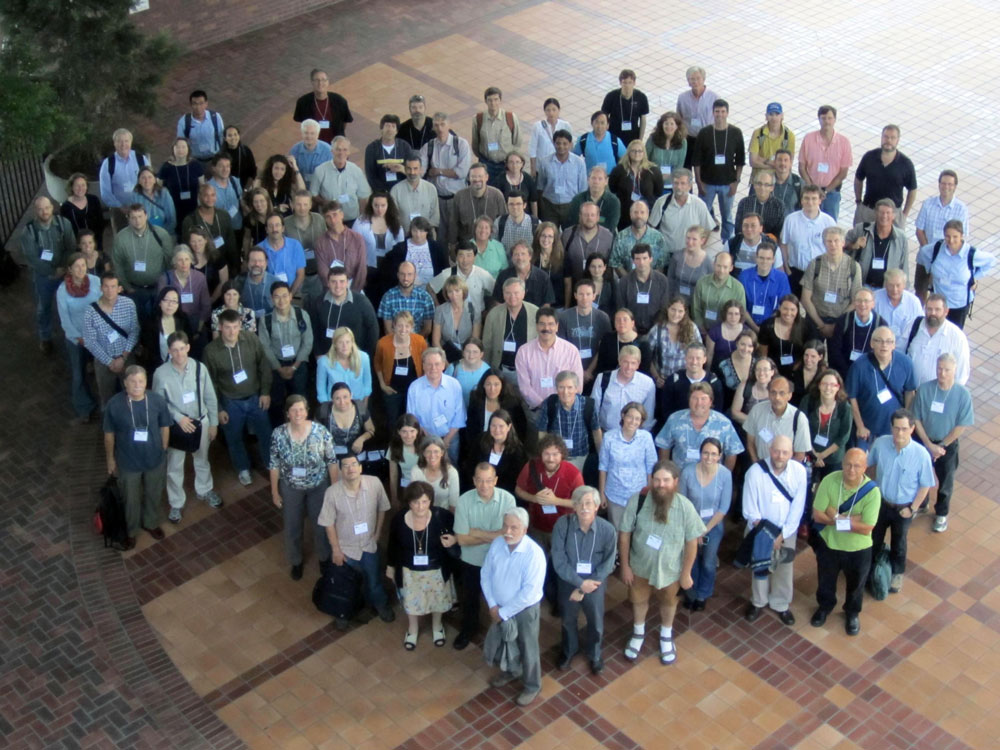
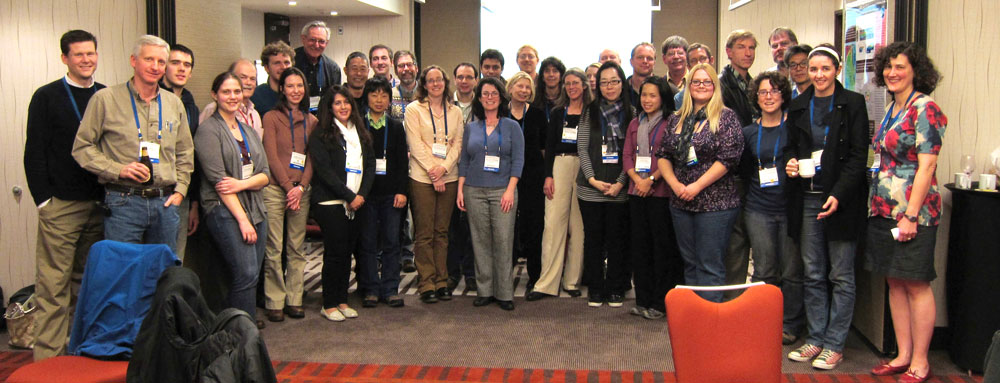
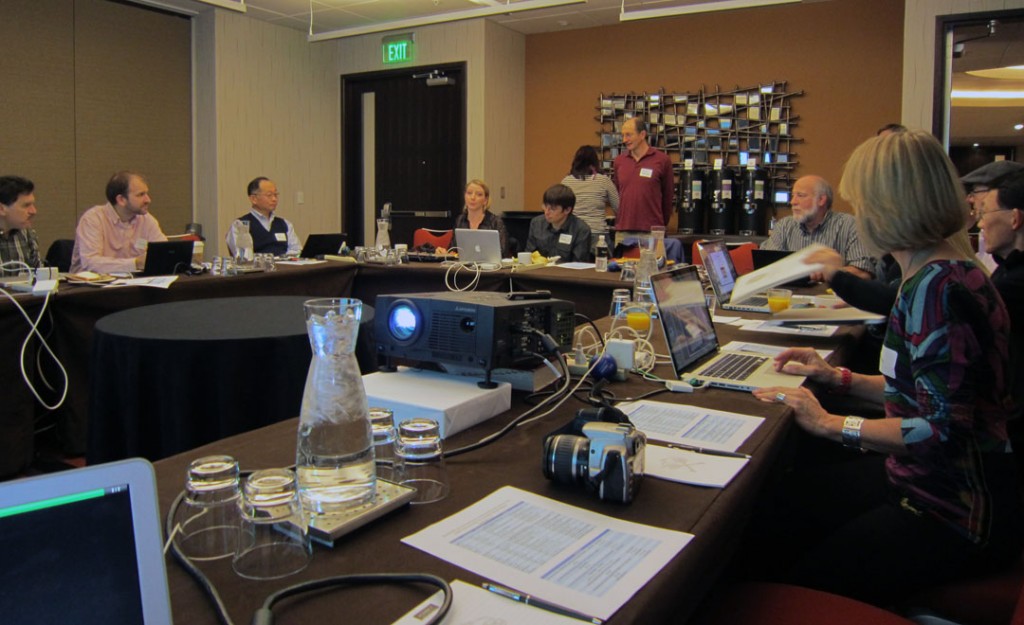
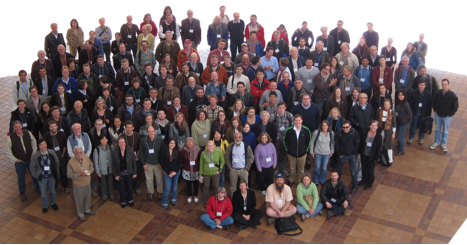
Figure1. GeoPRISMS-EarthScope Alaska Planning Workshop group photo.

Figure1. GeoPRISMS-EarthScope Alaska Planning Workshop group photo.

Objectives and Process

The objective of the workshop was to solicit community input about research opportunities and priorities that would form the basis for the GeoPRISMS science plan for the Alaska Primary Site. The starting point for the workshop was the Implementation Plan produced during the January 2011 meeting in Bastrop, Texas, where Alaska was identified as the lead primary site for the Subduction Cycles and Deformation (SCD) initiative of GeoPRISMS.

The workshop began with a series of plenary talks that provided an overview and then more focused examination of various aspects of the Alaska-Aleutian subduction system. These talks offered up-to-date summaries of Alaska-Aleutian geology, geophysics and geochemistry, to inform participants and to stimulate participants to think about key opportunities for GeoPRISMS research in the Alaska-Aleutian system. Talks focused on Alaska Margin Tectonics and History (Terry Pavlis and Dave Scholl), Surface Processes and Tectonics (Don Fisher and Sean Gulick), Magma Processes from Deep to Shallow (Peter Kelemen and Stephanie Prejean), and Mantle Processes and Geodynamics (Ikuko Wada and Peter van Keken). Bobby Reece, Rob Harris, Phaedra Upton, Susanne Straub, and Steve Holbrook presented several short talks on subjects proposed in white papers.

Breakout sessions began on the afternoon of the first day of the workshop. The objective of the first breakout was to identify key onshore and offshore research targets and data gaps, and to discuss the concept of “discovery corridors“ as an approach to identifying geographic focus areas within the Alaska-Aleutian system. Participants were encouraged to identify specific locations where GeoPRISMS resources might be most effectively focused on high-impact, shoreline crossing and interdisciplinary research efforts – the hallmarks of the GeoPRISMS program. Participants were encouraged to keep in mind that some important research objectives may be best suited to a thematic research approach, undertaken anywhere in the Alaska-Aleutian system or at any arc on Earth.

Participants were assigned to breakout groups based on their top two research interests chosen prior to the workshop from the SCD key topics. These breakout themes were (1) controls on size, frequency and slip behavior of subduction plate boundaries, (2) spatial and temporal patterns of deformation through the seismic cycle, (3) storage, transfer, and release of volatiles through subduction systems, (4) geochemical products of subduction and creation of continental crust, (5) subduction zone initiation and arc system formation, (6) feedbacks between surface processes and subduction zone dynamics.

Day one of the workshop ended with a series of short presentations on logistical considerations for fieldwork in Alaska. The major points of emphasis were the challenges of Alaskan weather and long distances, and the importance of long-range planning to allow for permitting along the Alaska-Aleutian margin, which is a patchwork of lands mostly under the control of various public agencies.

The second day of the workshop began with reports and discussion of the previous day’s breakout sessions. Next was a series of short presentations by a panel of potential GeoPRISMS partners. National organizations represented on this panel were the USGS and AVO (John Power), USGS Volcano Hazards program (John Eichelberger), USGS Extended Continental Shelf Project (Ginger Barth), the Cascadia Initiative (Richard Allen), and IRIS and USArray (Bob Woodward). International panel representation was from the German-Russian KALMAR Project (Christel van den Bogaard), Japan, IODP and JAMSTEC (Yoshiyuki Tatsumi), and Canada (Kelin Wang).

The second breakout session focused on implementation strategies. Participants considered possible “discovery corridor” locations, and identified overlaps and opportunities for synergistic GeoPRISMS and EarthScope activities. Breakout group leaders and participant attendance was the same as on day one to maintain continuity. Reports from breakout session leaders were given immediately after lunch. The third breakout session commenced late in the afternoon on day two. This time participants were mixed with respect to research interest but grouped with respect to their first and second geographic priorities for discovery corridor selection. The geographic sites were Cook Inlet, Alaska Peninsula, eastern Aleutians, Adak-Amlia area and westernmost Aleutians. A sixth breakout group called the Arc Line was also convened to characterize the “back-bone” of the Aleutian (oceanic) part of the Alaska-Aleutian margin, including geophysical imaging and along-strike changes in geophysical, geochemical, and geologic properties and processes.

The second day of the workshop ended after breakout three discussions, allowing the conveners to synthesize the plenary and breakout discussions so far. Their summary reports were presented in the morning of the third day of the workshop, leading into a productive plenary Q&A and discussion, during which broad consensus about GeoPRISMS science implementation in Alaska was reached.
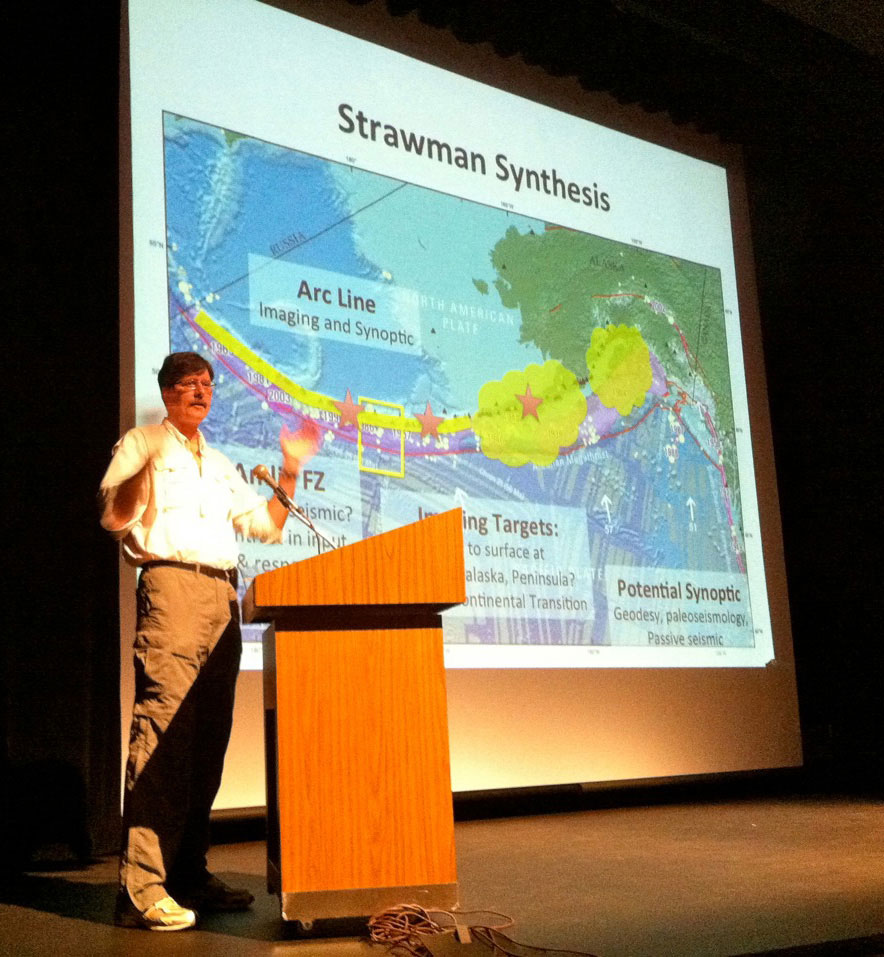
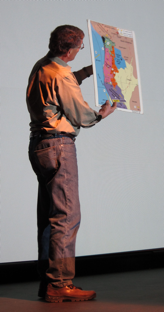
Figure 2. Jeff Freymueller summarizes the outcomes of the Alaska planning workshop break-out discussions.

Figure 2. Jeff Freymueller summarizes the outcomes of the Alaska planning workshop break-out discussions.

An Implementation Plan for Alaska

A key objective of breakout three discussions was to establish a prioritization of the six geographic areas under consideration for more focused research, measured here by break-out attendance. The cumulative attendances at each of the geographic areas were: the Alaska Peninsula (55); the Adak-Amlia area (48); Cook Inlet (37); the along-arc transect (32); followed by the eastern Aleutians (25) and the western Aleutians (13). An important outcome of breakout three was the similar scientific and geographic focus of the three groups interested in the Aleutian/oceanic part of the margin. Based on this, the convener group presented a proposed science implementation plan, emphasizing a geophysical transect along the oceanic part of the arc in combination with complementary focused studies of the Alaska Peninsula and Cook Inlet areas.

Workshop participants expressed broad support for a large geophysical deployment along the oceanic part of the arc. This geophysical transect is envisioned as the back-bone that provides a framework for focused studies at point locations encompassing varied aspects of the arc, fore-arc, trench and incoming plate. The Aleutian islands provide many advantages for testing ideas about crustal genesis in a subduction setting. The arc has never been rifted, thus the products of ~45 million years of island arc crustal growth are intact and available for study. Additionally, strong contrasts in trench sediment thickness and subducting plate age at the Amlia Fracture Zone area are linked to distinctive magma chemistries in the arc and a change in seismogenic character.

One or more trench/arc-perpendicular transects would intersect the along-arc transect. The highest priority transects are the intersection with the Amlia Fracture zone and focal points in the Adak and Unalaska areas, providing unique opportunities to characterize the birth and evolution of the arc. Volcanoes of the eastern Aleutian area (e.g., Okmok, Akutan, Shishaldin) also provide ideal targets, located on the backbone transect, for slab-to-surface geophysical imaging of the largest and most active volcanic centers in the Alaska-Aleutian subduction system.

The Alaska Peninsula features dramatic along-strike changes in the seismogenic zone, spanning megathrust rupture areas in different parts of their cycles and with a range of locking behaviors. It is the best location for combining onshore and offshore studies to investigate the causes of these changes. It offers the best opportunity to examine links between seismicity and forearc surface process and variable subduction inputs. This area also includes the most productive volcanoes of the continental part of the arc, with both large dominantly basaltic centers and smaller dominantly andesitic centers, including Katmai, which produced the largest eruption of the 20th century. The group also supported the idea of a future deployment of Cascadia Initiative ocean bottom seismometers in this region.

The Cook Inlet area is the continental end-member of the subduction zone, which experienced a watershed megathrust event in 1964, and is dominated in Quaternary time by glacial and other surface processes that direct sediment into the subduction zone and forearc. This region also shows the clearest evidence in Alaska for large slow-slip events and transient changes in seismogenic zone behavior. This region also features a transition to flat slab subduction due to the buoyant thick crust of the subducted Yakutat terrane, intense microseismicity in the downgoing plate, abrupt variations in shear wave splitting orientations, the SE end of a gap in the volcanic arc, and active faulting and folding of a broad region of the overriding plate.

Both Cook Inlet and the Alaska Peninsula are also areas with substantial opportunities for synergy with EarthScope due to the EarthScope instrumentation that will be in place there, and coordinated research opportunities with AVO (described below), AEIC, and other researchers actively studying processes there.

Alaska was chosen as the highest priority GeoPRISMS Primary Site because of the distinct along-arc changes in volcanism, seismicity, forearc structure, and subducting sediment thickness. Participants recognized that specific synoptic studies were needed that address these spatial changes along the entire arc as opposed to specific target areas. These studies could include geodesy, paleoseismology, surface processes and along-arc sediment transfer, arc geochemistry and geochronology, and passive seismic monitoring.

Impact, Influence and Benefits from Partner Organizations

There are clear opportunities for synergy between the GeoPRISMS and EarthScope Programs in Alaska, especially for the Cook Inlet area and also for the Alaska Peninsula. The two programs share many common scientific targets, including the seismogenic zone, fluid cycling, and arc development, The recent report from the May 2011 EarthScope workshop on science opportunities in Alaska discusses many scientific issues and goals that are directly in line with those of GeoPRISMS. EarthScope has supported the installation and operation of ~150 Plate Boundary Observatory (PBO) continuous GPS stations across Alaska, and will support a comprehensive seismic deployment across Alaska in the form of the USArray Transportable Array (TA).

Present and future EarthScope instrumentation in the Cook Inlet area, in particular, offers great opportunities for synergy between the programs on the many shared scientific targets. For example, the TA stations, augmented by EarthScope FlexArray or GeoPRISMS seismic deployments and existing seismic stations on volcanoes, offer the chance for detailed imaging of the mantle wedge and tracking magmas from slab to surface. PBO stations in the area have documented large slow slip events and other transient changes in the behavior of the seismogenic zone, highlighting a great opportunity for research on a topic of great importance for both programs. Other targeted GeoPRISMS investigations would form part of an overall, amphibious, GeoPRISMS and EarthScope research program.

The Alaska Volcano Observatory monitors active volcanoes, assesses the volcanic hazards along the Aleutian arc, and operates seismic networks on 31 of the active volcanoes. John Power, AVO scientist-in-charge, voiced strong support for GeoPRISMS studies. Existing seismic monitoring, geologic mapping, and geodetic monitoring will provide a wealth of background data for focused volcano research. Moreover, AVO is familiar with on-land access and logistical issues in the Aleutians, and they are willing to help provide guidance for involved researchers.

The far western Aleutian area (including the Komandorsky Islands and adjacent Kamchatka Peninsula) is the focus of ongoing work under the German-Russian KALMAR project, which will complement work in GeoPRISMS focus areas further east. Work completed under the first four years of KALMAR focused on several key GeoPRISM themes, including quantifying the volatile flux from active arc volcanoes in the Central Kamchatka Depression, and geochemical and geochronological studies aimed at an improved understanding of the magmatic history and evolution of island arc crust beneath the Komandorsky Islands. KALMAR dredging efforts sampled the incoming plate and fore-arc areas in front of the Komandorsky Islands, and large relict structures in back-arc areas. The prospect for a second four-year phase of the KALMAR project creates a strong international synergy between KALMAR and GeoPRISMS.

Possible international collaboration on the geophysical transect was also discussed, with JAMSTEC indicating strong support.

Broader Impacts

Unquestionably, GeoPRISMS and related studies in Alaska-Aleutian subduction zone have vital societal relevance, in a setting in which geohazards are very visible. The largest US subduction earthquake on record, the M 9.2 1964 Prince William Sound event, ruptured the eastern portion of the subduction megathrust, an area that continues to pose significant seismic hazard for local populations. Tsunamis spawned by large earthquakes and landslides along the Alaska-Aleutian subduction zone can affect the entire Pacific basin. The Aleutian arc is among the most active volcanic regions on the planet, with the potential to disrupt a critical air transport pathway between Asia, North America, and Europe.

The high visibility of geohazards in this setting also offers critical educational and outreach opportunities to GeoPRISMS. Established pathways exist through GeoPRISMS and EarthScope to convey important GeoPRISMS research results in Alaska into college classrooms around the country. Involving nearby schools and communities in instrument deployment and data collection has also proven effective. Efforts to develop a GeoPRISMS REU program would enable new training opportunities for future scientists interested in Alaskan studies. Cooperation with existing statewide programs will provide further outreach as research ramps up in the Alaska Primary Site.

Concluding Thoughts

The conveners thank the meeting attendees for their participation in the process of reaching consensus on the GeoPRISMS science plan for Alaska, and give special thanks to all of the speakers, breakout group leaders, and white paper authors for their contributions in making the workshop such a success. Finally, they want to recognize the enthusiastic participation of the graduate students and post-docs – their input is greatly appreciated.

A number of important tasks lie ahead. The conveners and breakout leaders will prepare a comprehensive workshop report for distribution by November 2011, and an updated draft of the GeoPRISMS Alaska science implementation plan by January 2012. The implementation plan will be made available for public comment prior to final release. It will serve as a guide for proposals submitted for the next NSF GeoPRISMS solicitation, July 1, 2012

 Reference information
REPORT: GeoPRISMS-EarthScope Planning Workshop for Alaska – an SCD Primary Site, Freymueller J. et al;

GeoPRISMS Newsletter, Issue No. 27, Fall 2011. Retrieved from http://geoprisms.nineplanetsllc.com

Bathymetric Surveys of the Cascadia Subduction Zone in Support of the Cascadia Initiative OBS Array Deployment


Chris Goldfinger, Oregon State University


As part of the 2009 Stimulus or ARRA (American Recovery and Reinvestment Act) spending, NSF’s Earth Sciences (EAR) and Ocean Sciences (OCE) divisions each received $5M in facility-related investment. The funds were targeted toward the creation of an Amphibious Array Facility to support EarthScope and MARGINS (now GeoPRISMS) science objectives. The initial emphasis and deployment site was onshore/offshore studies of the Cascadia margin, with an expectation that the facility would later move to other locations.

At the October 2010 CEIT OBS workshop held in Portland OR, a number or practical issues were raised in conjunction with this ambitious OBS deployment. One of these was the issue of good bathymetric data needed for good siting and safety of the instruments along the Cascadia margin. In addition, Cascadia is also now the site of the main components of the Ocean Observing Initiative (OOI) and Neptune Canada, the world’s premier cabled observatory systems, and these will be in operation collecting real-time data from a wide spectrum of sensors for decades to come. Cascadia has also now been chosen and a Focus Site for the NSF GeoPRISMS program, which will focus attention on Cascadia earthquake tectonics for the next decade.

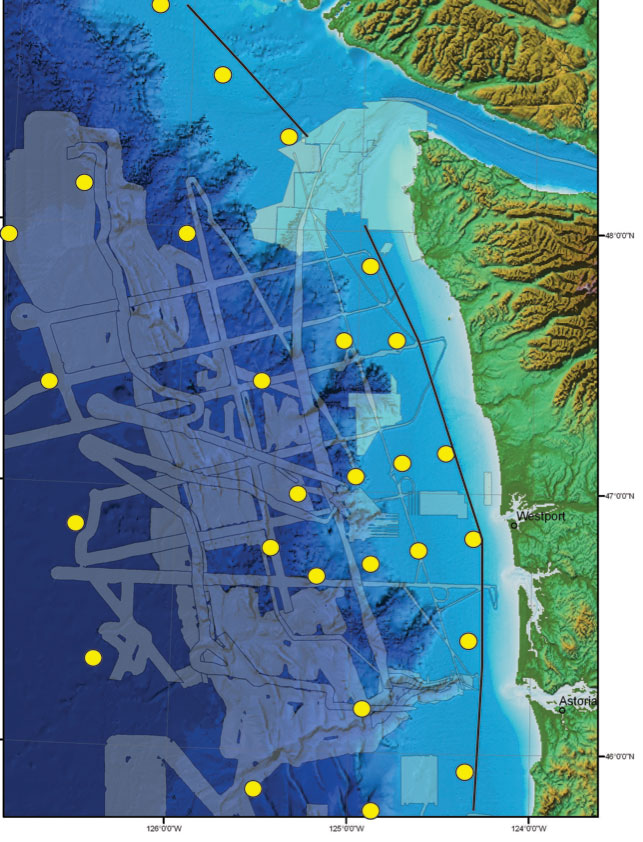
Figure 1. “Before” Bathymetric coverage of the Washington-Vancouver Island margin. Translucent overlay shows existing multibeam coverage from most known cruises mostly collected by OSU and restricted until recently. Remaining areas are only covered by sparse NOS soundings. Yellow dots are approximate OBS deployment locations for year one. Some of these were re-located to better sites in terms of trawl protection and topography after the 2011 cruise data were processed.

Figure 1. “Before” Bathymetric coverage of the Washington-Vancouver Island margin. Translucent overlay shows existing multibeam coverage from most known cruises mostly collected by OSU and restricted until recently. Remaining areas are only covered by sparse NOS soundings. Yellow dots are approximate OBS deployment locations for year one. Some of these were re-located to better sites in terms of trawl protection and topography after the 2011 cruise data were processed.

Bathymetric data for the OBS deployments

Good bathymetric data are essential for siting OBS station locations and ensuring the best chance of the instruments settling to the bottom in relatively smooth flat areas with a good chance of good recording fidelity. Equally important is to deploy instruments in areas where the topographic, structural, and hydrologic context is reasonably well understood, so that a maximum number of instruments will be recovered from each deployment. Some of the CI deployed instruments will be located on the abyssal plain of the Juan de Fuca plate, and are relatively safe from local geohazards. However, this initiative specifically addresses the Cascadia subduction boundary, and thus most of the instrument deployments are on the continental margin of this very dynamic plate boundary (Figure 1). Because many of the deployments span a number of active canyon systems and seismically active areas, good bathymetric data are also required to prevent a number of instruments from being swept into channels and canyons and lost or damaged during the deployment.

Current state of Cascadia bathymetric coverage

In the NE pacific region, the Cascadia margin and Cascadia basin has spotty coverage of modern multibeam data. 1980’s vintage EEZ survey data cover Oregon and Northern California from ≈600 m to the abyssal plain out to 1260W. This includes a major survey of the Gorda Plate done during an extended sea trial of the then new AGOR Ronald H. Brown. Much of the ridge system at The Gorda, Juan de Fuca and Explorer ridges and Blanco, Mendocino and the Nootka faults have multibeam data collected over the years during NSF and NOAA sponsored work. The EEZ data were collected in the 1980’s with the original 90 degree Seabeam Classic, now quite antiquated, but adequate for regional context. There are also very large gaps in even these data. The EEZ data collected in the 1980s off Washington was first “classified” by the Navy due to their submarine activity there, and then subsequently “lost” while in storage. Consequently, comprehensive coverage of the Washington margin has not been available. Through the 90’s and early 2000’s, OSU collected data on the WA margin in support of paleoseismic and other cruises, and there were also several cruises of the German vessel Sonne. These data were collected in mission specific areas, and with a variety of systems, and therefore not ideal for regional coverage. Releases of these data were for a time also restricted by the Navy, but since 2008 the data are no longer restricted, nor is collection of new data by academic and Government agencies. These older data were collected with now antiquated systems, including the original Krupp Atlas Hydrosweep and SeaBeam classic and SeaBeam 2000 systems. Shallow data, less than ≈600 m, are even more sparse. Some of the shallow banks in Oregon have been mapped with high resolution systems, and several other NOAA, NSF, MMS and state supported projects have mapped small portions of the shelf, but an estimated 75% of waters shallower than 600m remain unmapped.

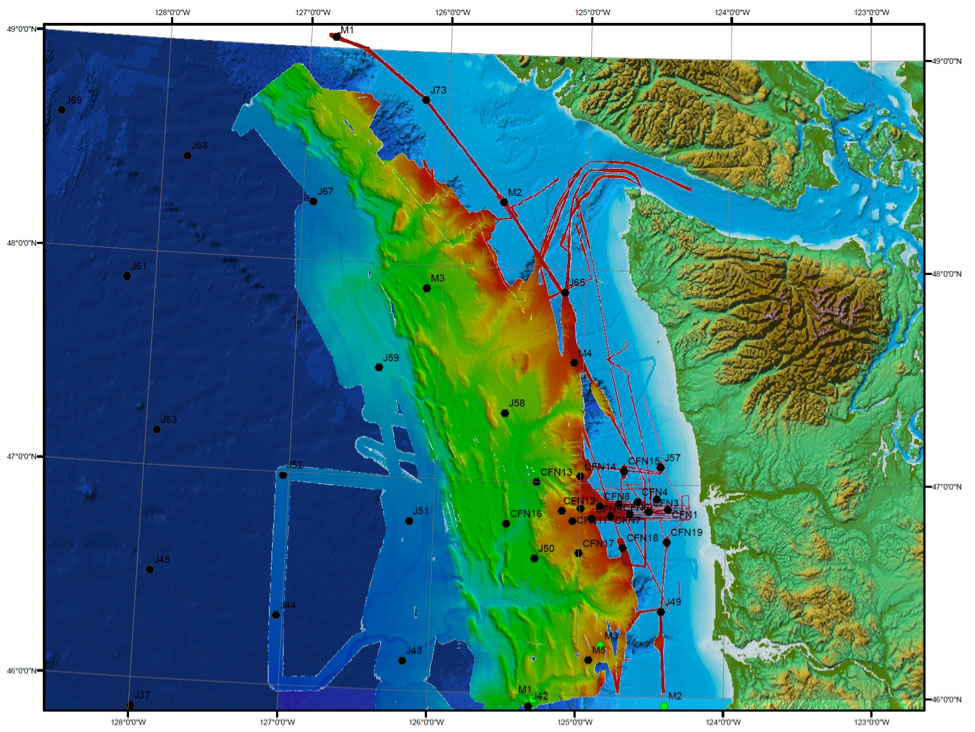
Figure 2. “After” Bathymetric coverage of the Washington-Vancouver Island margin following the June 2011 CEIT cruise with modified OBS locations. New and old data have been assembled in CARIS bathymetric database software.

Figure 2. “After” Bathymetric coverage of the Washington-Vancouver Island margin following the June 2011 CEIT cruise with modified OBS locations. New and old data have been assembled in CARIS bathymetric database software.

The need for new bathymetric data

At a minimum, small patches of bathymetric data are desirable for site location of Cascadia margin OBS sites, where even the location of major canyon systems is only approximately known (Washington and Vancouver Island). Minimal patch size should be at least a few km2 in order to ensure safe and effective deployments. A better approach however would be to survey contiguous larger areas that serve to aid in deployments, but also to establish the structural context of the deployments and of the Cascadia margin, which was the approach supported for this project.
Beyond the CIET OBS deployment, this project took the opportunity to, for the first time, obtain a nearly complete image of the Cascadia Subduction Zone that will make significant steps toward filling gaps in our knowledge of the regional tectonics of the Cascadia margin. The project is supportive of the goals of the CIET OBS array, the OOI and GeoPRISMS objectives, and also directly addresses the issue of regional earthquake hazards. The ideal vessel for this purpose was the R/V Thomas Thompson, with its newly upgraded Kongsberg EM-302 multibeam system, with the best resolution for the ≈1000-2500 m target depth range for much of the survey. This vessel, working at survey speeds can also collect concurrent 3.5 kHz Chirp sub-bottom data during the survey work, which is also useful for deployment assessment and many other purposes.

In planning the cruise, we prioritized the most hazardous sites on the margin, and also prioritized completion of margin coverage that is useful for OOI, GeoPRISMS, and regional context. Most mid-plate sites are relatively near existing coverage, but will be surveyed on future cruises if possible before deployment (Figure 1).

The priority survey area on the Washington margin is shown in Figure 1 with existing multibeam coverage along with approximate OBS site locations. Final site choices have and will take advantage of less hazardous sites than shown in Figure 1, as well as trawl closures and the existing Olympic Coast Marine Sanctuary to avoid natural and anthropogenic hazards.

Figure 2 shows the “after” picture of the Washington-Vancouver Island margin. Older bathymetric data have been combined with new data in CARIS in this image. Ongoing work will attempt to reconcile the several generations of sonars used, tide, velocity and other corrections as well as to edit and improve the older data where possible to produce a final surface integrated with existing soundings where multibeam data are still lacking. This will also be done for the Oregon-Northern California parts of the margin where less extensive new data were also collected to fill smaller gaps. A final compilation of the Cascadia margin will be made available to the community when complete in 2012

 Reference information
Bathymetric Surveys of the Cascadia Subduction Zone in Support of the Cascadia Initiative OBS Array Deployment, Goldfinger C.;

GeoPRISMS Newsletter, Issue No. 27, Fall 2011. Retrieved from http://geoprisms.nineplanetsllc.com
Status of the Ocean Bottom Seismology Component of the Cascadia Initiative


By the Cascadia Initiative Expedition Team (CIET)

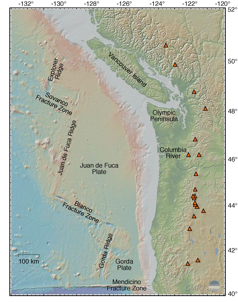
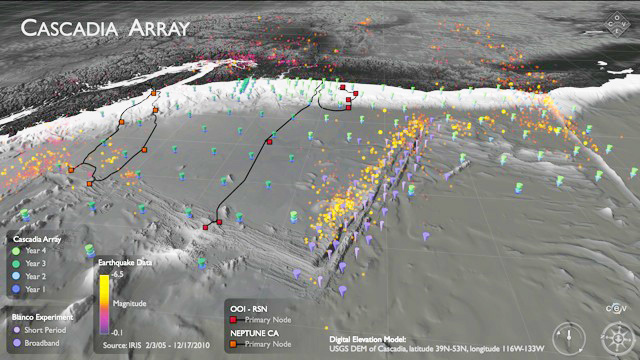
Figure 1. Oblique shaded relief map showing the Cascadia Array.::The four-year deployments plan of the OBS array, cabled networks associated with NEPTUNE Canada and OOI, earthquake distributions, oceanic spreading centers, and transform faults are all shown.

Figure 1. Oblique shaded relief map showing the Cascadia Array.::The four-year deployments plan of the OBS array, cabled networks associated with NEPTUNE Canada and OOI, earthquake distributions, oceanic spreading centers, and transform faults are all shown.

The Cascadia Initiative (CI) is an onshore/offshore seismic and geodetic experiment that takes advantage of an amphibious array to study questions ranging from megathrust earthquakes to volcanic arc structure to the formation, deformation and hydration of the Juan de Fuca and Gorda plates. This diverse set of objectives are all components of understanding the overall subduction zone system and require an array that provides high quality data that crosses the shoreline and encompasses relevant plate boundaries. An article in the previous GeoPRISMS Newsletter (Spring 2011, issue No. 26) described CI scientific objectives, the outcome of an open community workshop held in October 2010 to develop deployment plans for the offshore component of the experiment, and formation of the Cascadia Initiative Expedition Team (CIET). This article provides an update of CIET activities including the first year of CI OBS deployments (summer 2011) and related Education and Outreach (E&O) efforts.

Over its planned 4-year data acquisition period, the offshore portion of the Cascadia Initiative will involve the deployment and recovery of ~280 OBSs at ~160 different sites and a total of about 14 cruises. Each OBS deployment site requires careful evaluation to ensure that the notional deployment plans developed at the 2010 CI workshop take into consideration local bathymetry, trawling hazards and the presence of fragile ecosystems. The CIET incorporates this information into a detailed deployment plan that includes a prioritized deployment schedule. It is anticipated that the adjustments to most deployment sites will be minor (e.g., small changes in drop coordinates to avoid geological hazards or take advantage of preexisting multibeam bathymetry). However, practical considerations may require some larger changes to the notional plans developed at the 2010 CI workshop in which case the CIET has developed a procedure for revisions, as described on the CIET web site. Scientific oversight is required at sea to ensure that operation decisions driven by instrument failures, bad weather or other factors are guided by the scientific objectives of the experiment. A detailed cruise report will be produced for each cruise to fully document the experiment.

The CIET has been actively discussing and planning the 2011 deployments for several months. Since we are geographically distributed and our schedules are often conflicting we use a variety of communication tools. These include regular emails, a CIET web site that provides wiki capabilities, and bi-weekly conference calls with minutes and action items posted to the CIET site. The CIET website is currently used by the group for communication, discussion and limited data exchange. Much of the website content is viewable by the community. Looking toward the future, the CIET site will also be used for education and outreach, communication with the scientific community, and development and delivery of metadata pertaining to OBS deployments and recoveries (e.g., cruise reports). The CIET will hold its first face-to-face meeting this fall in Seattle on September 13 and 14.

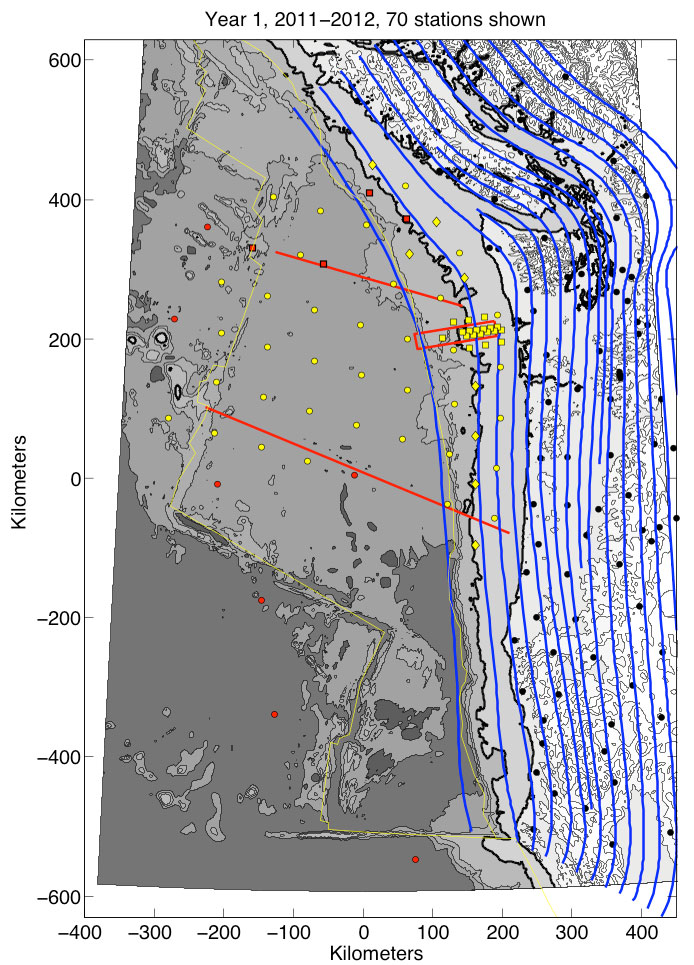
Figure 2: Year 1 Deployment Plan.::Red circles denote the reference array. Yellow circles denote the Regional Array. Yellow squares denote the Focused Array. Yellow diamonds denote the densified coverage of the forearc enabled by requesting 10 additional instruments from the OBSIP pool. Black circles denote on land broadband seismometers. Red squares denote the NEPTUNE Canada seismometers. Blue lines denote slap depth contours (every 10 km). The 1000 m bathymetry contour is shown in bold. See 2010 CI Workshop Report for further descriptions.

Figure 2: Year 1 Deployment Plan.::Red circles denote the reference array. Yellow circles denote the Regional Array. Yellow squares denote the Focused Array. Yellow diamonds denote the densified coverage of the forearc enabled by requesting 10 additional instruments from the OBSIP pool. Black circles denote on land broadband seismometers. Red squares denote the NEPTUNE Canada seismometers. Blue lines denote slap depth contours (every 10 km). The 1000 m bathymetry contour is shown in bold. See 2010 CI Workshop Report for further descriptions.

2011 FIELD SEASON

In accord with the deployment plan developed at the CI Workshop, the CIET proposed to NSF to deploy 70 OBSs during the 2011 field season according to the Year 1 plan (Fig 1). All of the OBS deployments will be done from the R/V Wecoma. Given the limited deck space on this ship, 3 cruises will be required to deploy all 70 OBS. The cruise schedule and chief scientists for 2011 operations are as follows:

  • Leg 1, July 23 – August 2, 2011. Chief Scientists: Maya Tolstoy (LDEO), Anne Trehu (OSU)
  • Leg 2, October 15-29, 2011. Chief Scientists: Robert Dziak (OSU), Del Bohnenstiehl (NCSU)
  • Leg 3, October 30 – November 12, 2011. Chief Scientists: John Collins (WHOI), Emilie Hooft (UO)

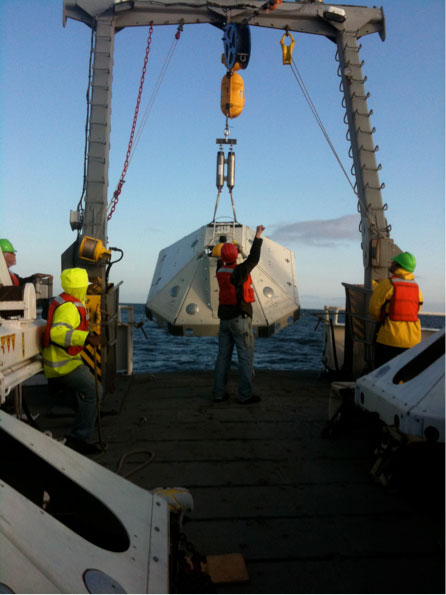
CI Leg 1 – W1107A: The first OBS deployment cruise for the Cascadia Initiative took place between July 23rd and August 2nd 2011 aboard the Research Vessel Wecoma. The cruise deployed 15 of the newly designed LDEO-OBSIP Trawl Resistant Mounted OBSs or TRM-OBSs; the original goal was to deploy 20 TRM-OBSs, however, 5 were not fully built. These instruments are designed to provide a shield around the seismometer that should both reduce current noise and provide some protection from the bottom trawl fishing that occurs along the Cascadia margin. The instruments were therefore targeted for deployment at shallow sites (<1000 m) where trawling and currents are most likely to be an issue. The TRM-OBSs contain a Trillium compact seismometer as well as a Paros Instruments Absolute Pressure Gauge (APG), which should be useful in reducing long period noise and in measuring seafloor deformation. The TRM-OBSs will record continuously at 125 samples/sec until they are recovered in early summer 2012 using either an attached pop-up buoy system (instruments < 200 m water depth) or a Remotely Operated Vehicle (ROV).

The TRM-OBSs were largely used to fill the sites of the northern focused array that were < 1000 m depth because of the advantage of having a tight array of APGs. The CIET and the Amphibious Array Steering Committee (AASC) provided a prioritized list of sites prior to the cruise to enable the co-chief scientists to adapt the deployment pattern as necessary while at sea. Individual site locations were adjusted based on feedback from the chair of the Oregon Fisherman’s Cable Committee (OFCC), and different iterations of site locations were identified with the letters B, C and D appended to the site name and number. It is important for both the instruments and the safety of the fishing community and their equipment that regularly fished sites be avoided.
One site was inadvertently deployed at a heavily fished site, and attempts to recover it using the attached pop-up buoy failed. The instrument ended up upside down, which was a serious hazard to the fishing community. This instrument was recovered on August 14th by John Delaney and Deborah Kelley (UW), who generously took time out of their Visions11 cruise to pick up the TRM-OBS using ROV Ropos aboard the R/V Thompson. A video of the recovery can be seen online.

Two community college students were able to join the cruise as part of a summer enrichment program designed by Dean Livelybrooks (Univ. of Oregon) to introduce community college students to science. A PhD graduate student and an undergraduate IRIS summer intern also participated. Having a full complement of watchstanders and 2 co-PIs enabled us to operate research around the clock. While the OBS team slept, 4 & 12 kHz surveys were conducted to image bubbles in the water column from cold seeps in the region.

This cruise was the first full deployment of this new OBS design, and as such, much was learned. You can read a detailed account of the cruise activities in the cruise report which can be found at the CIET website. We are grateful to the Captain and Crew of the R/V Wecoma and the science party, who all worked extremely hard to make the cruise as successful as it was.

Figure 3. An LDEO-TRM OBS being deployed aboard the R/V Wecoma in July 2011.::The white octagonal frame is designed to sink a few inches into the sediment and shield the seismometer from current noise and trawl fishing.

Figure 3. An LDEO-TRM OBS being deployed aboard the R/V Wecoma in July 2011.::The white octagonal frame is designed to sink a few inches into the sediment and shield the seismometer from current noise and trawl fishing.

CI Leg 2: The second CI leg will take place from October 15-29, 2011 aboard the R/V Wecoma, leaving from and returning to Newport, OR. This expedition will deploy 25 OBSs, 15 from SIO and 10 from LDEO. The fifteen SIO OBSs will also be installed in trawl-resistant enclosures and are equipped with Differential Pressure Gauges (DPGs); these instruments are deployable at depths extending from the shelf down to 6,000 m. The remaining ten LDEO instruments are not in trawl resistant enclosures and so must be deployed below 1,000 m; they do carry APGs.

CI Leg 3: The third CI leg will take place from October 30 – November 12, 2011 aboard the R/V Wecoma, leaving from and returning to Newport, OR. This expedition will deploy 25 OBSs, 15 from WHOI and 10 from the OBSIP pool. All these OBSs are not trawl resistant and will be deployed at depths deeper than 1000 m; they carry DPGs.

CI EDUCATION AND OUTREACH

The Cascadia Initiative Education and Outreach (E&O) program is developing two opportunities during its first year, led by Dean Livelybrooks (UO):

1. The ‘CC@sea’ project supports community college (‘CC’) student participation in OBS deployment, retrieval and pre-cruise and follow-up outreach activities in CCs, high schools and the community. CC@sea> leverages another NSF (STEP) program, Undergraduate Catalytic Outreach and Research Experiences (UCORE) that has built strong ties with six Oregon community colleges. Two community college (‘CC’) students participated in the 23-July to 2-August OBS deployment cruise of the R/V Wecoma. The Fellows stood watch, helped with instrument deployment and made movies of all aspects of sea-going research. Dean Livelybrooks also participated in this first sea-going leg to initiate and supervise these activities. The goal of the CC@sea> program is to attract students from diverse, non-traditional backgrounds to a four-year degree in physical sciences and that these students transfer their experiences to the community and their peers. CC@sea> personnel made a very entertaining and informative video suitable for other community college and high school students during the first deployment leg, which will be shown in science classes at participating UCORE campuses and elsewhere.

2. A fall planning, teacher professional development workshop for a seismometers @ schools (S@S) program, where teachers and students, with assistance, install, monitor, and interpret seismograms and characterize shaking at school sites to advocate for seismic retrofit upgrades in older schools in the Pacific NW.

Figure 4. Final deployment locations for W1107A cruise

Figure 4. Final deployment locations for W1107A cruise

CIET Membership:

Doug Toomey (Team Leader, University of Oregon), Richard Allen (University of California, Berkeley), John Collins (Woods Hole Oceanographic Institution), Bob Dziak (OSU/NOAA, Newport, OR) Emilie Hooft (University of Oregon), Dean Livelybrooks (University of Oregon) Jeff McGuire (Woods Hole Oceanographic Institution), Susan Schwartz (University of California, Santa Cruz), Maya Tolstoy (Lamont Doherty Earth Observatory), Anne Trehu (Oregon State University), William Wilcock (University of Washington)

 Reference information
Status of the Ocean Bottom Seismology Component of the Cascadia Initiative, the CIET Team (Toomey et al);

GeoPRISMS Newsletter, Issue No. 27, Fall 2011. Retrieved from http://geoprisms.nineplanetsllc.com
IODP Workshop on Using Ocean Drilling to Unlock the Secrets of Slow Slip Events


Laura Wallace, Eli Silver, Nathan Bangs, Rebecca Bell, Stuart Henrys, Joshu Mountjoy, and Ingo Pecher

Figure 1. Workshop group photo.

Figure 1. Workshop group photo.

From August 1 to 5, 2011, 70 geoscientists and student researchers from a dozen countries gathered in Gisborne, New Zealand, to discuss how scientific ocean drilling can help to elucidate the processes behind slow slip event (SSE) occurrence. Gisborne was chosen as a venue for this workshop due to its close proximity above the source area of shallow slow slip (<5-15 km depth) that occurs at the northern Hikurangi subduction margin in New Zealand.SSEs are a new class of shear slip found at subduction margins around the globe that have revealed the broad spectrum of fault slip behaviour. SSEs are widely acknowledged as one of the most exciting discoveries of the last decade in the Earth Sciences, and have implications for plate boundary processes and the seismic hazard posed by subduction megathrusts. The relatively shallow depths of subduction thrusts exhibiting SSEs in New Zealand (north Hikurangi), central Japan (Boso Peninsula), and Costa Rica (Nicoya Peninsula) (5 – 10 km below seafloor) potentially puts them within reach of IODP drilling. The possibility for direct access to these faults suggests that scientific drilling could play an important role in revealing the physical processes behind SSEs. The main goals of the workshop were to summarize critical requirements of a drilling program to discern the physical mechanisms responsible for SSE behaviour, develop strategies to achieve the scientific goals, determine what types of data are needed to develop an effective drilling program, and identifying the expertise and technologies needed to drill a SSE source area successfully. Additional geophysical experiments in support of any IODP drilling were also addressed.

Oral presentations at the Gisborne workshop were organized into thematic sessions centered around (1) observations of and theories for slow slip event occurrence, (2) lessons learned from previous IODP drilling at subduction zones, and (3) focused talks on potential slow slip drilling targets in New Zealand, Costa Rica, and central Japan. The talks were interspersed each day with breakout discussion sessions and broader group discussions. Breakout sessions over the first 2 days focused on the measurements and experiments needed to understand the origins of SSE and how these plans might be applied to potential IODP drilling projects in New Zealand, Japan, and Costa Rica. On the final day, breakout groups sat down and developed implementation plans for each location.

A number of fundamental conclusions came from the workshop: (1) further development and site characterization is needed at each of the sites to be able to effectively examine slow-slip processes along the plate interface with drilling. At each of the sites, additional data is needed to refine the locations, magnitudes, timing, slip regions, relationship to earthquakes, and cyclicity of SSEs. We concluded that we can achieve these goals with a combination of onshore geodetic and seismic experiments combined with offshore long-term deployment of ocean bottom seismographs equipped with pressure sensors to monitor vertical seafloor deformation. (2) Also critical are complementary, collocated studies for developing regional-scale characterization and development of site locations. These include (but are not limited to): structure and tectonics, physical properties, stratigraphy and lithologies, and thermal structure, using active source 2D and 3D seismic imaging and wide-angle refraction, passive source studies, heat flow surveys, and multibeam seafloor mapping. Auxiliary data are required to both help identify drilling targets and compliment borehole data and monitoring; (3) Shallow level borehole monitoring is key to address questions related to the spatial distribution of slow slip beneath offshore subduction margins, and to reveal the possible relationship between SSEs and normal seismicity, as well as discerning changes in fluid flow and geochemistry within the upper plate during the SSE cycle. Monitoring will be supported with coring and logging for ground truth and detailed characterization of lithology, stratigraphy, structure, fluids, and physical properties above the SSE source regions; (4) Drilling, logging and sampling of the SSE source area will provide the most direct information on the physical conditions (frictional properties, mineralogical composition, fluid pressure conditions, temperature, among others) that lead to and control slow slip event behaviour. Participants agreed that deep drilling of an SSE source area is within reach and is the ultimate way to solve the mystery of why SSEs occur.

Figure 2. Oblique view of the Hikurangi subduction margin, including locations of slow slip (orange shaded), the location of the workshop and fieldtrip route, and the proposed slow slip event drilling targets offshore Gisborne.

Figure 2. Oblique view of the Hikurangi subduction margin, including locations of slow slip (orange shaded), the location of the workshop and fieldtrip route, and the proposed slow slip event drilling targets offshore Gisborne.

One of the interesting discoveries during the workshop was the realization by participants that the world’s best-documented areas of shallow (<20 km depth) slow slip events in Costa Rica, central Japan and New Zealand have some striking similarities. Specifically the 3 margins include: relatively cold temperatures on the interface in the SSE source regions, similar slow slip event durations (generally ~2-3 weeks), and comparable equivalent moment magnitudes per event (Mw ~6.5). Costa Rica and north Hikurangi have further similarities in that both margins are characterized by subduction erosion, and each exhibit a regular two-year SSE recurrence interval. We expect that continued comparison and contrasting of these 3 subduction zones and their shallow slow slip event behavior begun at the workshop will lead to new insights into the mechanisms behind shallow SSEs.

The main 3-day workshop was followed by a 2-day field trip, from Gisborne to Wellington. The fieldtrip was designed to expose participants to the onshore, uplifted components of the Hikurangi forearc and provide a complete transect of Hikurangi margin active tectonics. The fieldtrip also tracked above the slow slip event source areas of the Hikurangi subduction zone, and gave participants insights into the geological and tectonic context of slow slip in the North Island.

Just after the fieldtrip, on 6-7 Aug approximately 45 of the Gisborne workshop participants met to develop the full proposals and implementation plans for a proposed project to use IODP drilling to understand slow slip event processes offshore Gisborne, at the northern Hikurangi margin. We expect that these efforts will be of interest to the GeoPRISMS community, as New Zealand has been recently selected as one of the primary focus sites for the Subduction Cycles and Deformation (SCD) program. The evolving effort towards IODP drilling at north Hikurangi may provide an important focal point for SCD research in the New Zealand region in the coming years.

The workshop was supported by funding from IODP-MI, the New Zealand Ministry of Science and Innovation, the Consortium for Ocean Leadership, and GeoPRISMS. A full report on the workshop outcomes will be developed for IODP over the next few months, and will be publicly available once it is completed.

 Reference information
IODP Workshop on Using Ocean Drilling to Unlock the Secrets of Slow Slip Events, Wallace L. et al;

GeoPRISMS Newsletter, Issue No. 27, Fall 2011. Retrieved from http://geoprisms.nineplanetsllc.com
Deep Mapping of the Megathrust on Land and at Sea around the Alaska Peninsula


Donna Shillington (Lamont-Doherty Earth Observatory at Columbia University)

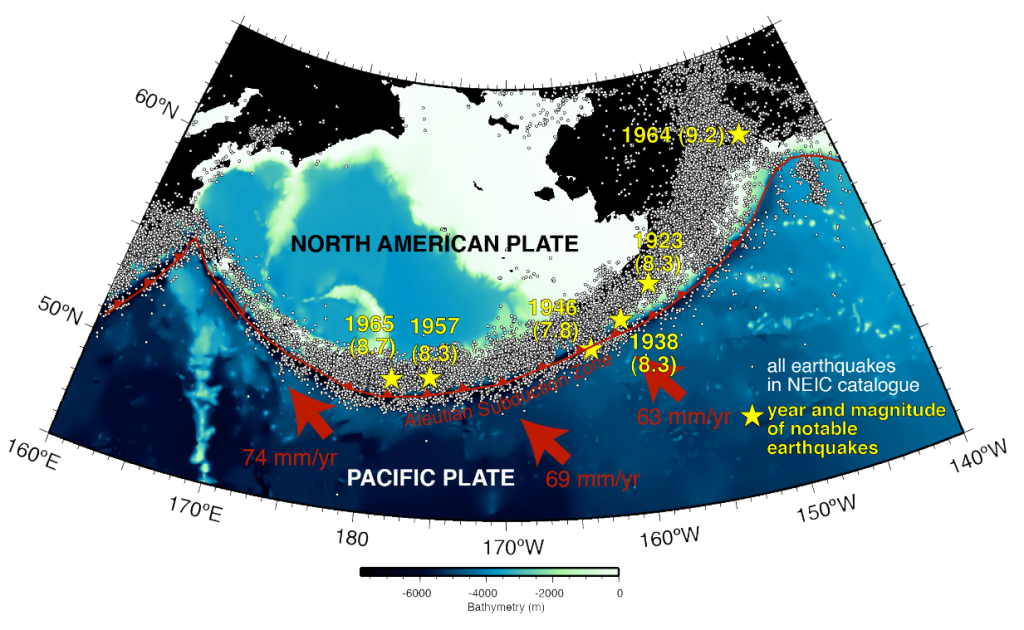
Figure 1. Simplified map of the Alaska Subduction Zone, showing distribution of catalog (white dots) and notable (yellow stars) earthquakes along the margin. Red arrows indicate absolute plate motions

Figure 1. Simplified map of the Alaska Subduction Zone, showing distribution of catalog (white dots) and notable (yellow stars) earthquakes along the margin. Red arrows indicate absolute plate motions

The Mission: Mapping the Alaska Megathrust

The 2500-km-long subduction zone offshore southern Alaska regularly produces large, destructive earthquakes. One of the big conundrums about these settings is how large of an area locks up on the contact between these plates (called the ‘megathrust’) and then ruptures in earthquakes. To tackle this question, my colleagues and I collected data on land and at sea in the summer of 2011 to produce an image of the megathrust, constrain the properties of rocks around and within the megathrust and link these fault properties to the earthquake history here. Our expedition focused on a part of the subduction zone off the Alaska Peninsula that exhibits very big changes in slip behavior. Some parts of this plate boundary lock up and then rupture catastrophically in big earthquakes. In other areas, the plates appear to be smoothly sliding by each other and thus do not produce great earthquakes. The Semidi segment last ruptured in a great earthquake (magnitude 8.3) 73 years ago in 1938. This area has an estimated recurrence interval of ~50-75 years, and thus might be due to produce another big earthquake soon. However, just to the west lies the Shumagin gap, an area that has not produced a great earthquake historically. Imaging a major fault boundary that lies tens of miles under the seafloor is not an easy task, but we had exceptional tools for the job. We used the R/V Marcus G. Langseth to acquire seismic reflection data and onshore/offshore wide-angle reflection/refraction data. Sound waves generated by an array of air guns were recorded on two 8-km-long streamers, an array of ocean bottom seismometers and onshore seismometers.

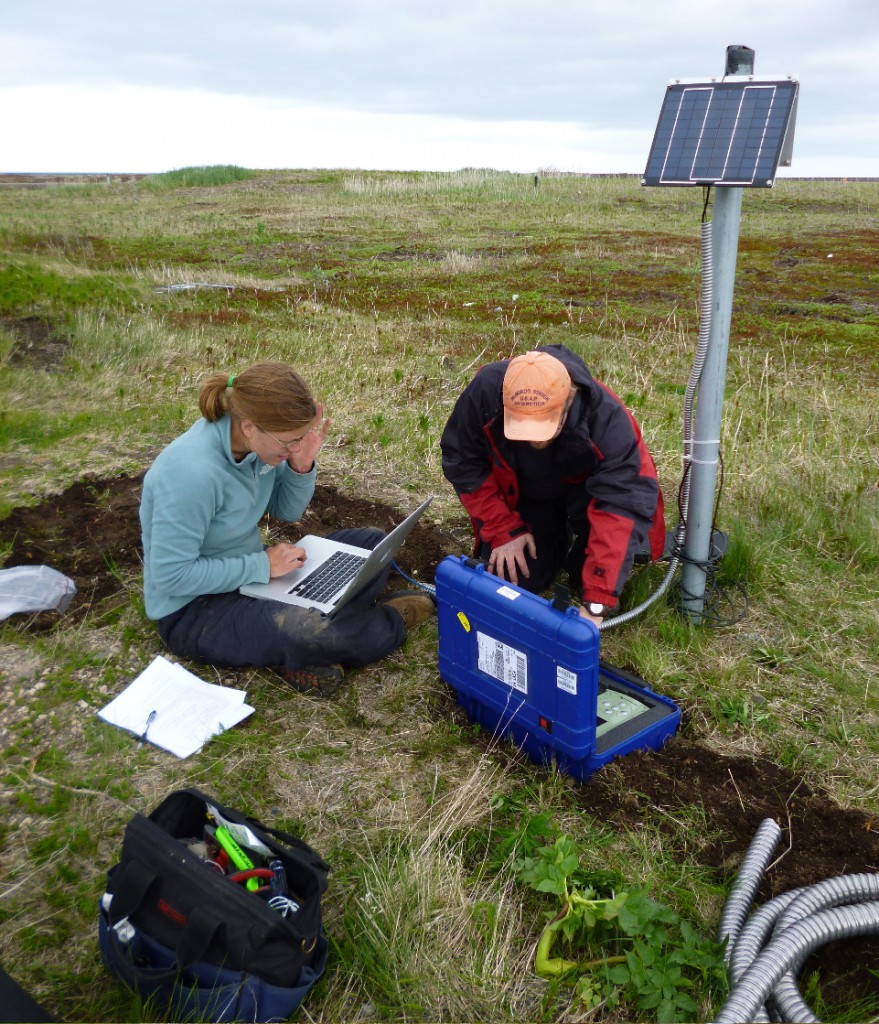
Figure 2. Katie Keranen and Guy Tytgat deploying a seismometer in Port Heiden

Figure 2. Katie Keranen and Guy Tytgat deploying a seismometer in Port Heiden

June 17-24: Installing seismic stations on the Alaska Peninsula

The first component of our program involved deploying seismometers onshore around the Alaska Peninsula with Katie Keranen (Univ. OK) and Guy Tytgat (PASSCAL). These instruments recorded small, local earthquakes, distant large earthquakes and (importantly for our project) the sound source of the R/V Langseth. The Alaska Peninsula is too rugged and expansive for a network of roads, so planes, helicopters or boats are the only transportation options. We decided to charter a plane based in Nelson Lagoon, a town of 80 people situated on a long, narrow sandy spit jutting out into the Bering Sea. The weather dictates when and where you can fly each day, and it varies dramatically. We were lucky enough to have several clear days (even saw some blue skies and sunshine!), but other days we were grounded by weather and wiled away the time indoors at our inn. While we were in the air, we saw majestic, snow capped volcanoes shrouded in clouds, expansive views of the sparsely vegetated Alaska Peninsula, which is riddled with rivers and lakes, and lots of wild life: caribou, bears, seals, walruses and eagles (just to name a few). It is a landscape that seems remarkably untouched by humanity.

Local communities were unwaveringly helpful and friendly in helping us find places for our stations. The two school districts here kindly granted us permission to install our seismic stations at any of their schools, and we also obtained permission to place equipment at various lodges and village offices. Residents volunteered to take our gear and us from the airstrip to our sites. In one town, our pilot made a general plea over the radio: “Is anyone listening on Channel 3? I’m here at the airstrip with scientists who need a ride to the school”. Someone answered immediately and picked us up 5 minutes later.

Many of our sites are in spectacular places near remote lodges or in towns nestled between mountains and the ocean. All of them are home to impressive wild life that poses a risk to our equipment, particularly bears. We protected the equipment against curious small animals but fully bear-proofing a station for a short (two-month-long) deployment was not feasible. Instead, we hoped that placing our stations in villages (rather than in the wild) would provide some protection, but we also needed good luck…

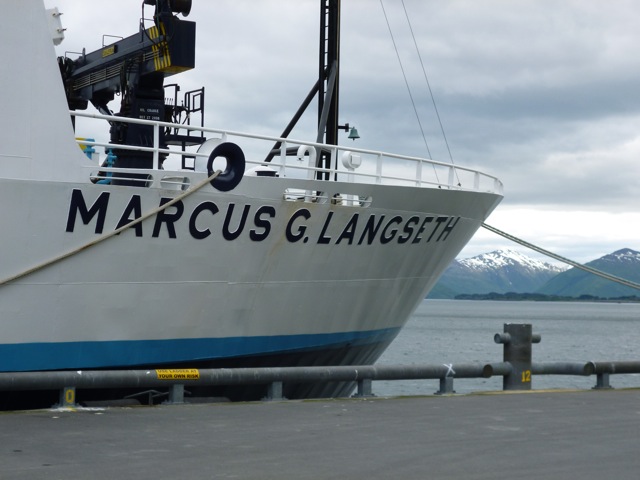
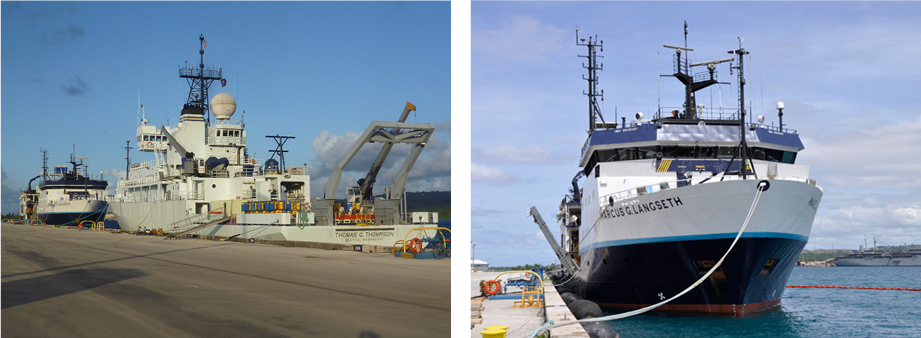
Figure 3. The R/V Langseth in port of Kodiak, with snowy mountains in the background

Figure 3. The R/V Langseth in port of Kodiak, with snowy mountains in the background

June 24-29: Transitioning from land to sea

Seven days and eleven flights after we arrived in Alaska, we finished deploying our seismic stations onshore. Our final constellation of stations differed a little from our original plan (as they always do), but achieved our main goal of instrumenting the part of the Alaska Peninsula nearest to our planned offshore work on the R/V Langseth. As luck would have it, we finished deploying our seismometers just in time to catch a large earthquake (magnitude 7.4) that occurred farther west in the Aleutians around the Fox Islands. After the onshore work was finished, Katie and Guy departed for home, and I flew to Kodiak to meet the R/V Langseth and our shipboard science party, including other chief scientists Mladen Nedimović (Dalhousie) and Spahr Webb (LDEO). Kodiak offered beautiful sights, delicious seafood and local beer (including Sarah Pale Ale!), but our science party was eager to leave for sea. We departed Kodiak on a sunny evening on June 29 for our 38-day-long research cruise.

June 29-July 11: Deploying and retrieving ocean bottom seismometers

The next part of our program involved using ocean bottom seismometers (OBS) to record seismic waves generated by the sound source of the Langseth. OBS’s are autonomous instruments that sit on the seafloor and record sounds waves traveling through the earth and the water. Floats made from glass balls and syntactic foam make each OBS buoyant, but an anchor holds it on the seafloor during the study. We placed OBS’s from Scripps Institution of Oceanography on the seafloor along two lines extending across the major offshore fault zone. The larger the distance between the sound source (earthquakes or air guns) and the seismometer, the deeper into the earth the recorded sound waves travel. OBS are not attached to the vessel and are also very sensitive, so they can record sound waves generated very far away (commonly >200 km). Because we want to examine deep fault zones that cause large earthquakes off Alaska, OBS are a critical part of our effort.

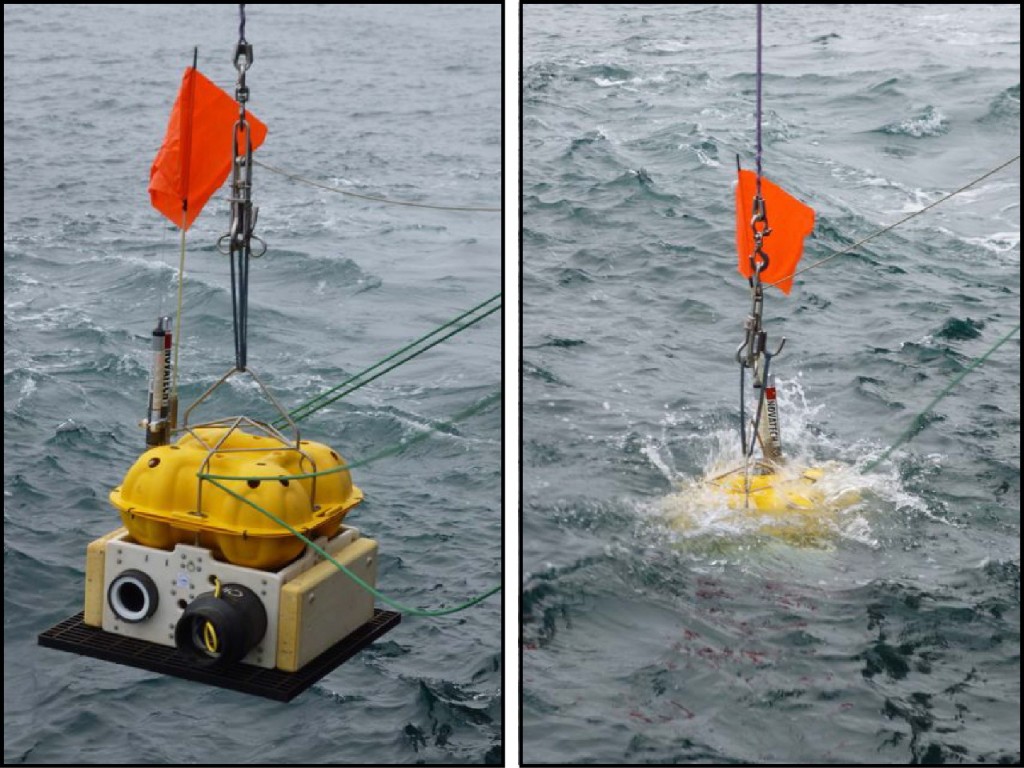
To deploy the OBS, we simply lifted them over the side of the ship with a large crane and gently dropped them in the water, after which they slowly sank to the seafloor. It never ceases to amaze me that we can throw a bundle of very sophisticated electronics over the side of the ship and hope to pick it up and retrieve information from it. Yet, it works! After leaving OBS on the seafloor along each line for ~3 days to record sound waves generated by the air guns of the Langseth, we returned to collect them. After receiving an acoustic signal to release from its anchor, the OBS rises through the water at 45 meters per minute. When the water is deep, it can be a long wait. Some of ours were 5500 m below the surface! The recovery of OBS always involves a certain amount of suspense. Despite all of the advanced engineering and planning that goes into these instruments, it is an inherently risky endeavor. Happily, we recovered 100% of our OBS.

Figure 4. Deploying an OBS

Figure 4. Deploying an OBS

Despite all the technology required to place a seismometer many miles below the ocean on the seafloor and summon it back to the surface, many aspects of actually plucking the OBS out of the ocean and pulling it on deck are remarkably low tech. Once the OBS is spotted floating on the surface, the ship drives along side. It is akin to driving your car up next to a ping-pong ball. Scientists and techs lean over the starboard side of the Langseth with large poles and attempt to attach a hook with rope to the top of the OBS. Its not always easy since the OBS is bobbing up and down on the waves. Once we hook it, we can attach a rope to the wench and haul the OBS onboard. Sometimes, OBS bring back surprises – an octopus returned with one of our OBS! He was alive and healthy, so we returned him to the ocean (though some lobbied that we keep him for lunch…)

July 11-August 5: Seismic reflection profiling with miles and miles of streamer

On July 11, we finished our OBS work, and began the second phase of the cruise: recording sound waves from the Langseth’s airgun array with two 8-km-long (5-mile-long) cables (or streamers) filled with pressure sensors. Changing gears in terms of scientific activities also involved changes to our science party; we swapped personnel by boat transfer in Sand Point on a beautiful sunny evening. The Scripps OBS team departed, and we were joined by new reinforcements, including five undergraduate students from Columbia University.

Our seismic streamers are stored on gigantic spools, which unreel cable off the back of the ship into the ocean. A large buoy is affixed to the end of the streamer, and ‘birds’ are attached along its length, which can be used to control the depth of the streamer. Large paravanes hold the streamers apart; these are like large kites flying off the back of the ship in the water. Deploying miles of streamer and the other attending gear is an impressively long and complicated undertaking, which also involves a fair amount of intense manual labor. But after 3 days, all of the gear was in the water. Once data acquisition began, we settled into a routine of watchstanding and standard shipboard data processing. Ship time is precious, so we collect data 24 hours a day, seven days a week.
One of the core objectives of our project is to image the deep parts of the plate tectonic boundary, which required us to go as far north (and as close to the coast) as possible. This was easier said that done! The southern edge of the Alaska Peninsula is rugged and flanked lots of small jagged islands and shallow features just below the surface of the ocean, and there is also more fishing activity close to the coast; both pose risks to the seismic gear. One of our closest approaches to land was near Unga, one of the Shumagin islands. At the apex of the turn, our streamers came within less than a mile of the coast. Due to some early difficulties with our equipment, we had to repeat this maneuver several times. I held my breath and watched our third (and final) pass from the bridge. After the ship and gear passed safely through the most harrowing part of the turn, the captain turned to me and asked, “We’re not going to do this again, are we?” Thankfully not! At least not there. But there were several other important parts of our survey that required close approaches to the coast to image critical parts of the boundary.

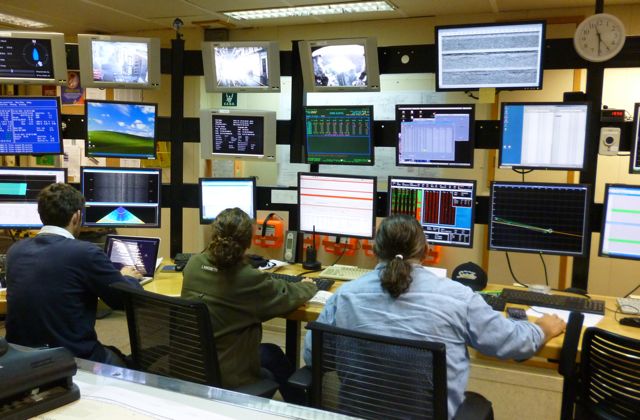
Figure 5. Watch-standers at work in the lab

Figure 5. Watch-standers at work in the lab

Over the course of our cruise, we were treated to amazing views of marine life, including fish, whales, seals and birds. On one memorable day, we found ourselves surrounded by three species of whales, including a rare North Pacific Right Whale. But we tried to keep our distance from marine mammals. Since we are creating sound waves to image the earth, and they use sound to navigate and communicate with one another, our activities might disturb them; we suspended operations if a mammal came too close.

We used our new data to create very preliminary images of the structures below the seafloor as we went. A regular sight in the main lab was a group of people gathered around a computer screen or a large paper plot, talking and pointing excitedly. It was exhilarating to glimpse faults, sediments and other structures in our data for the first time and ponder what they might be telling us about this active plate tectonic boundary. But we have a lot of hard work ahead after the cruise to obtain concrete results from our voluminous data – we acquired over 3 Tb (3000 gigabytes!) of raw seismic data during the cruise! At 6:30 am on August 5, the R/V Langseth pulled into port in Dutch Harbor, marking the end of our very successful research cruise. Our steam into port from our study area involved a trip through Unimak pass and beautiful views of Aleutian volcanoes, including majestic Shishaldin.

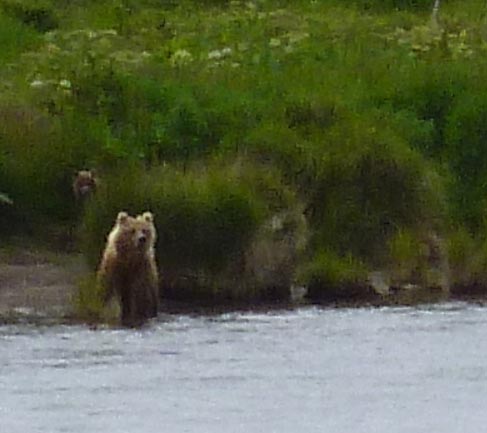
Figure 7. Bears at Bear Lake, Alaska

Figure 7. Bears at Bear Lake, Alaska

August 5-10: Back to the Alaska Peninsula

Many people flew home after our arrival in Dutch Harbor, but not me! (At least not immediately). Katie Keranen and I returned to the rugged Alaska peninsula to recover the land seismometers that we deployed way back at the beginning of the summer. An Anchorage-bound flight from Dutch Harbor dropped me off in Cold Bay to rendezvous with Katie. After the plane landed, the stewardess asked for our “Cold Bay passenger” to disembark. Passenger. Singular. I filed past all the folks heading to Anchorage and beyond. Katie and I returned to all of our sites by charter plane. According to our pilot, it was a very foggy summer on the Alaska Peninsula, but we were blessed with excellent weather, allowing us to pick up all of our instruments in just a day and a half. Multiple attempts were required to recover a seismometers we placed Heredeen Bay; on the first try, we saw a large brown bear only 20 feet away from the plane! But to our delight, none of the stations had been disturbed by wild life, and all of them recorded data for the entire summer. After recovering our last station at Bear Lake, we rewarded ourselves by lingering at beautiful lodge there. We tried (unsuccessfully) to catch some fish and watched bears pick through the brush on the other side of the river. And after an amazing 55 days on and around the spectacular Alaska Peninsula, I happily headed back to NYC.

Special thanks to the following:

Onshore Science Party: Katie Keranen (Univ. Oklahoma), Donna Shillington (LDEO), Guy Tytgat (Passcal Instrument Center)

Offshore Science Party: Donna Shillington (LDEO), Mladen Nedimovic’ (Dalhousie University), Spahr Webb (Lamont), along with Ann Bécel, Matthias Deleschluse, Harold Kuehn, Jiyao Li, Berta Biescas, Aaron Farkas, Andrew Wessbecher, Celia Eddy, Kelly Hostetler, Hannah Perls, Jack Zietman

Figure6_field_Alaska_Peninsula

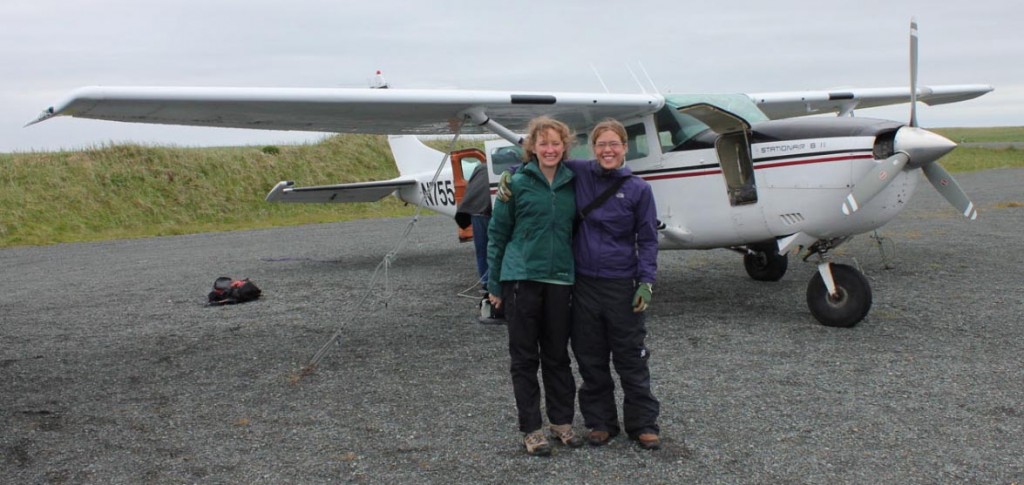
Figure 6. Donna and Katie on their way to another station.

“Report from the Field” was designed to inform the community of real-time, exciting GeoPRISMS -related research. Through this report, the authors expose the excitement, trials, and opportunities to conduct fieldwork, as well as the challenges they may have experienced by deploying research activities in unique geological settings. If you would like to contribute to this series and share your experience on the field, please contact the GeoPRISMS Office at info@geoprisms.nineplanetsllc.com. This opportunity is open to anyone engaged in GeoPRISMS research, from senior researchers to undergraduate students.
We hope to hear from you!

 Reference information
Deep Mapping of the Megathrust on Land and at Sea around the Alaska Peninsula, Shillington D.;
GeoPRISMS Newsletter, Issue No. 27, Fall 2011. Retrieved from http://geoprisms.nineplanetsllc.com
Report on GeoPRISMS Mini-Workshop at Fall 2011 AGU – “ExTerra: Understanding Convergent Margin Processes Through Studies of Exhumed Terranes”


AGU Fall Meeting 2011, San Francisco

M. Feineman1, S. Penniston-Dorland2, B. Savage3

1Pennsylvania State University; 2University of Maryland; 3University of Rhode Island

Figure 1. GeoPRISMS ExTerra mini-workshop participants.

Figure 1. GeoPRISMS ExTerra mini-workshop participants.

On the evening of December 7, 2011, about 35 geoscientists convened in the ExTerra mini-workshop during the fall AGU Meeting to discuss how to integrate the study of exhumed rocks into the GeoPRISMS Subduction Cycles and Deformation (SCD) initiative (Figure 1). After introductory presentations by the convenors and keynote speaker Brad Hacker (University of California, Santa Barbara), workshop participants divided into four groups based on different types of exhumed terranes: subducted slab, mantle wedge, arc crust, and fault systems. The group discussion was divided into two areas: identification of scientific objectives and organizational strategies. Details of the outcomes from each discussion group are outlined at http://www.geoprisms.nineplanetsllc.com/scd/exterra.html. This is an ongoing discussion leading to a white paper contribution to the GeoPRISMS SCD Science Plan, and we invite all interested parties to participate!

What is ExTerra?

The NSF GeoPRISMS Science Plan for the SCD Initiative identified the study of exhumed terranes as an important component of subduction zone research. It remains to be determined how to best integrate the study of exhumed terranes and high pressure rocks into GeoPRISMS SCD. GeoPRISMS largely follows the very effective model used previously by MARGINS of building a research program around a few locations, referred to as primary sites, atactive subduction, these features are buried deep beneath the surface. Of necessity, exhumation most often occurs during or following the death of a subduction zone. The nature of exhumation processes is such that entire subduction zones are rarely if ever exposed in a single location, requiring fieldwork to be conducted at multiple locations, and most often by multiple research groups using different techniques and approaches, before a comprehensive range of pressure and temperature conditions can be represented. Currently, the study of exhumed terranes is included in the GeoPRISMS Implementation Plan as a thematic study. The goal of this mini-workshop and the resulting white paper is to explore how we can best organize research on exhumed terranes under the umbrella of GeoPRISMS SCD such that we might accomplish more as a group than we could as individuals working independently.

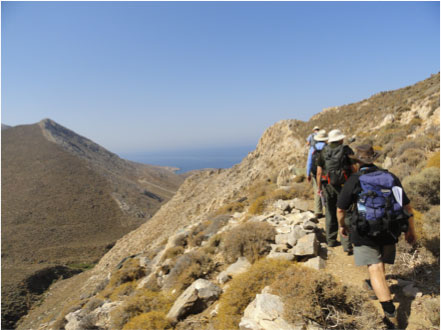
Figure 2. SOTA fieldtrip to see Cycladic subduction zone rocks on the island of Syros, Greece.

Figure 2. SOTA fieldtrip to see Cycladic subduction zone rocks on the island of Syros, Greece.

What can studies of exhumed systems contribute to GeoPRISMS?

The integration of studies of exhumed systems through GeoPRISMS can organize individual efforts towards major interdisciplinary objectives. Integration of data from multiple sites allows coverage of a broad range of conditions not observable at a single site. Studies of exhumed systems under the umbrella of GeoPRISMS have the potential to link experiments and seismic observation to physical reality, adding the components of space and time. Collaboration and communication between different communities represented within GeoPRISMS allow sample and data collection to be tuned to serve the needs of other groups (geochemists helping seismologists, petrologists helping modelers, etc.).

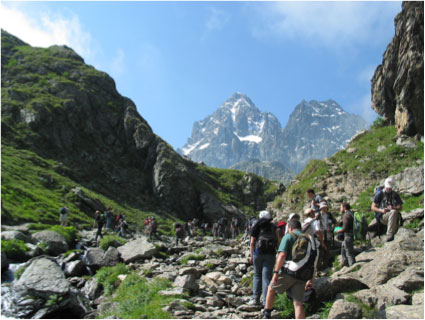
 Figure 3. ILP Subduction channel workshop fieldtrip to the Monviso Ophiolite, W. Alps, Italy.

Figure 3. ILP Subduction channel workshop fieldtrip to the Monviso Ophiolite, W. Alps, Italy.

Target areas

Four target areas have been identified as significant to improving our understanding active subduction processes by the study of exhumed terranes: 1) subducted slab, including HP and UHP rocks such as blueschists, eclogites, and metapelites; 2) mantle wedge, including serpentinites, ophiolites, and peridotites; 3) middle and lower arc crust, including granitoids, gabbros, migmatites, gneisses, amphibolites, granulites; and 4) exhumed fault systems, including accretionary prisms.

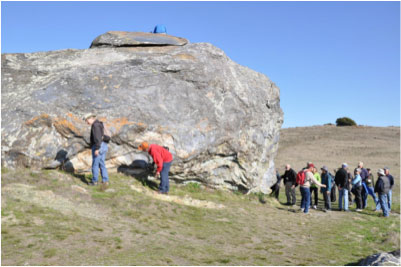
Figure 4. AGU Fieldtrip to see subduction zone rocks of the Franciscan Complex, CA.

Figure 4. AGU Fieldtrip to see subduction zone rocks of the Franciscan Complex, CA.

Fostering Interdisciplinary Communication

Several different ideas have been suggested in order to facilitate communication among different geoscientists. One idea is to hold focused, interdisciplinary field trips in order to provide the opportunity for non-field geologists to observe exhumed rocks and create an environment for exchange of ideas between field geologists and non-field geologists. Another idea is to create a sample repository and associated database that will allow sample collectors to connect with those who have use for rock samples. For example, experimental petrologists can make use of a sample repository to find materials for their experiments.

Challenges

We recognize that there are many challenges facing the integration of the study of exhumed terranes into GeoPRISMS. How do we open the dialog between petrologists, geophysicists, and modelers? How can studies of worldwide exhumed terranes be related to current GeoPRISMS focus sites? GeoPRISMS is a small program, and we will need to leverage with funds from outside sources.

 icon-chevron-right Go to the mini-workshop webpage

Reference information

Report on GeoPRISMS Mini-Workshop at Fall 2011 AGU – “ExTerra: Understanding Convergent Margin Processes Through Studies of Exhumed Terranes”, Feineman M., Penniston-Dorland S., Savage B.;

GeoPRISMS Newsletter, Issue No. 28, Spring 2012. Retrieved from http://geoprisms.nineplanetsllc.com
Report on GeoPRISMS Mini-Workshop at Fall 2011 AGU – “Using Geoinformatics Resources to Explore the Generation of Convergent Margin Magmas”


AGU Fall Meeting 2011, San Francisco

R. Stern1, M. Feigenson2, K. Lehnert3, A. Goodwillie3, P. van Keken4, J. Kimura5, B. Dreyer6, E. Jordan1,  W. Lieu1

1University of Texas, Dallas; 2Rutgers University; 3Lamont-Doherty Earth Observatory; 4University of Michigan; 5IFREE, JAMSTEC; 6University of California, Santa Cruz

Figure 1. Dec. 2011 GeoPRISMS geoinformatics workshop participants. Front row (L to R): M. Feigenson, Warren Lieu, Erika Jordan, Peter Michael, Megan Derrico, Nick Deems, Sara Douglas, Andrew Goodwillie, Jun-ichi Kimura. Back row: Charles Bopp, Bob Stern, Kerstin Lehnert, Guillaume Girard, Tyrone Rooney, Katherina Vogt, Osamu Ishizuka, Brian Dreyer, Julia Morgan, Peter van Keken

Figure 1. Dec. 2011 GeoPRISMS geoinformatics workshop participants. Front row (L to R): M. Feigenson, Warren Lieu, Erika Jordan, Peter Michael, Megan Derrico, Nick Deems, Sara Douglas, Andrew Goodwillie, Jun-ichi Kimura. Back row: Charles Bopp, Bob Stern, Kerstin Lehnert, Guillaume Girard, Tyrone Rooney, Katherina Vogt, Osamu Ishizuka, Brian Dreyer, Julia Morgan, Peter van Keken

Twenty geoscientists attending Fall AGU forsook the chance to enjoy a beautiful Sunday in San Francisco on December 4, 2011, and chose instead to descend into the bowels of the Grand Hyatt for the chance to explore how geoinformatics can help geoscientists understand the composition and generation of convergent margin magmas. The all-day workshop was organized in support of the science goals of the GeoPRISMS Subduction Cycles and Deformation (SCD) Initiative. SCD aims to understand how subduction zones work, from cold, shallow regimes (accretionary prism, forearc crust, and the seismogenic zone) to deeper, hotter regions where fluids and melts from the subducted slab trigger melting in the convecting asthenosphere above it. SCD builds on and integrates the successes of the predecessor MARGINS Seismogenic Zone and Subduction Factory experiments, targeting the Aleutian and Cascade arcs as community-chosen focus sites. The techniques and insights developed from studies of these arcs can be applied globally, and we hope to attract more geoscientists to join the “subduction parade”. In our efforts to involve a more diverse group of geoscientists in this effort – from students to university professors to expert researchers – we need to develop better, more accessible tools for this community to use. The Geoinformatics workshop was an effort to attract new members of the GeoPRISMS SCD team and help prepare these geoscientists.

Figure 2: Dec. 2011 GeoPRISMS Geoinformatics Workshop in action. Andrew Goodwillie explains GeoMapApp to workshop participants

Figure 2. Dec. 2011 GeoPRISMS Geoinformatics Workshop in action. Andrew Goodwillie explains GeoMapApp to workshop participants

These are lofty goals that can only be realized if interested geoscientists gather to explore effective tools and how they can be used. The most important community tools are databases, data visualizations, and data analysis software. Examples of each of these were highlighted in the workshop, as is clear from the agenda below (with pertinent links and other information). Each 50 minute long session encouraged questions and comments from workshop participants and was followed by a 10-minute break that allowed folks to stretch and refuel with plenty of food and beverages provided by GeoPRISMS.

  1. Geochemical databases and how to access them – Kerstin Lehnert (LDEO) explained how geochemical databases such as PetDB, Georoc, SedDB, and NAVDAT (all of which can be accessed via Earthchem) are increasingly important aspects of teaching and research (including GeoPRISMS SCD). Kerstin also explained how the new SESAR (System for Earth Sample Registration) can resolve problems of sample ambiguity (for example: how many samples have the same ID, e.g., how many “D1” samples are there in dredge collections around the world?) and data redundancy (for example: how many samples have been analyzed multiple times for different elements and isotopes, each reported with slightly different IDs that are entered separately into one or more databases?). Kerstin emphasized how important it was that samples studied as a result of GeoPRISMS SCD should each be registered for(International Geo Sample Number), a 9-digit alphanumeric code that uniquely identifies samples and provides information about where these can be found.
  2. Data Visualization Tool: GeoMapApp – GeoMapApp is an Earth science exploration and visualization application that is maintained and improved as part of the Marine Geoscience Data System at LDEO. There are several YouTube GeoMapApp multimedia tutorials that can be accessed. Of special interest to this workshop is the fact that GeoMapApp has a new feature that allows users to determine the depth of the subducted slab beneath a given arc volcano, and one tutorial shows how to do this, using the global compilations of Syracuse and Abers (2006).
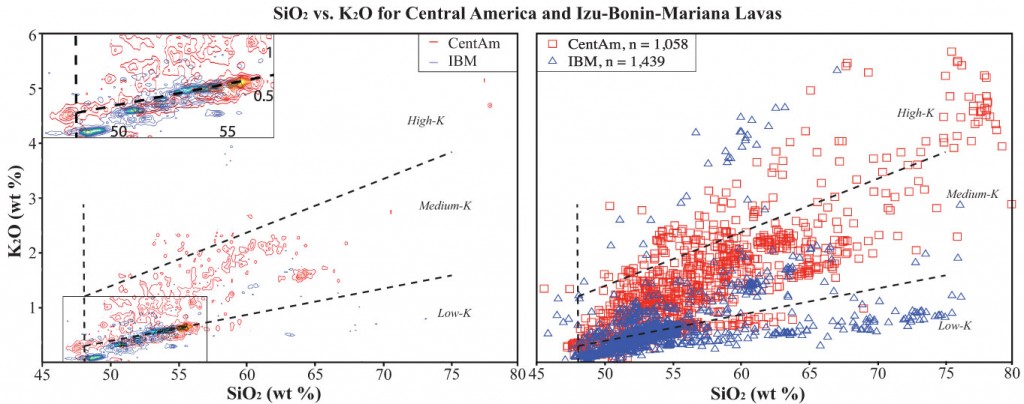
  3. Central America and Izu-Bonin-Mariana arc geochemical databases – Erika Jordan and Warren Lieu (UT Dallas). CentAm and IBM were focus sites for the MARGINS Subduction Factory experiment and geochemical data for these from EarthChem have been compiled and are being filtered so that these can be made available as an Earthchem data library. Erika summarized the status of compilations for volcanic front lavas from these two focus sites, using graphs to show their geochemical similarities and differences. Once completed, these compilations will be available to anyone as a Geochemical Reference Library. One of the important issues related to such compilations is how to best show these data. There are hundreds to thousands of data points in these compilations, so individual points on graphs often lie on top of each other and it can be difficult to see underlying structure. Warren showed how large data sets can be contoured and it is clear that making such data visualization tools available will be key for exploiting large geochemical data sets.
  4. Thermal structure of subducted slabs – Modeling the thermal structure of subduction zones and using geochemical and geophysical data to test and refine these models is leading to some of the most rewarding collaborations between geodynamic modelers, geophysicists, and geochemists. After lunch, Peter van Keken (U. Michigan) presented some of the latest thinking about how lithosphere age and convergence rate control temperatures in subduction zones. It is the slightly (~1%) more dense nature of the ~100 km thick lithosphere relative to ambient mantle that makes plates subduct, but it is the thin veneer of subducted sediments and the upper, altered portion of the oceanic crust– typically only a few tenths of a percent of everything that is subducted – that controls the subduction zone incompatible element budget. We cannot understand the trace element and isotopic composition of arc lavas without understanding how sediments are cooked in the subduction zone kitchen. Subducted sediments lie athwart a very strong temperature gradient between hot convecting asthenosphere and cool conducting lithosphere, so it is not surprising that our thinking has fluctuated between a consensus that subducted sediments beneath the arc mostly are sufficiently cool that they only release hydrous fluids to the idea that they are mostly hot enough to melt. Thermal models for subducted sediments need to be tested and refined with geophysical and geochemical data and experiments.
  5. Introduction to Arc Basalt Simulator 3.1 – Jun-ichi Kimura (JAMSTEC/IFREE) presented the theoretical underpinnings of an evolving software package for understanding arc petrogenesis, called “Arc Basalt Simulator”, or “ABS”. ABS is a forward model designed to match the incompatible trace element and radiogenic isotopic composition of primitive (high Mg#) arc lava by inputting appropriate subducted sediment and altered oceanic crust compositions and compositions of unmodified mantle wedge, choosing an appropriate subduction zone thermal model (from Syracuse et al., 2010) and adjusting some other subduction zone parameters, such as where fluids or melts are extracted from the downgoing slab and the depth of mantle melting. ABS is an Excel-based spreadsheet that can be run on any PC or Mac, so all members of the GeoPRISMS SCD community can use it. A tutorial walks the new user through the various functions of ABS 3.1. The ABS spreadsheet and ABS tutorial can be downloaded from the Geochemical Resource Library. A recent paper (Kimura et al., 2010) uses ABS version 3.1 to investigate compositions of primitive magmas along the Izu arc, and a new version (ABS 4) is being developed by Dr. Kimura and colleagues.
  6. ABS exercise – Bob Stern (UTD) and Mark Feigenson (Rutgers) provided some practical experience with ABS3.1. Bob walked workshop participants through each of the ABS3.1 user-adjustable functions, then Mark showed the group how ABS 3.1 could be used to understand the composition of primitive Cerro Negro (Nicaragua) lavas.
Fig3_geoinfo_s2012

Figure 3. Two different ways to present large compilation geochemical datasets for volcanic rocks from the magmatic fronts of MARGINS Subduction Factory focus sites in Central America (CentAm, red, n=1,058) and Izu-Bonin-Mariana (IBM, blue, n=1,439), using K2O vs. SiO2 as an example. Most Central American lavas have higher K2O contents at a given SiO2 content than most Izu-Bonin-Mariana samples. Left panel presents contoured data, right panel shows individual data points. Contoured data draws attention to where data are concentrated, plots of individual data draws attention to outliers

There are some useful lessons to be learned for others considering proposing future workshops before or after national geoscientific meetings like AGU or GSA. It is important to start planning early so that possible participants have the workshop on their “radar screens” before they buy their air tickets for the meeting, and so these societies can include the workshops on meeting announcements. In addition, workshop conveners should make a strong push to advertise the workshop at least two months before the meeting, in order to maximize workshop attendance. The conveners would be happy to discuss other considerations with people thinking about proposing a GeoPRISMS workshop.

 icon-chevron-right Go to the mini-workshop webpage

References

Kimura, J.-I., Kent, A.J.R., Rowe, M.C., Katskuse, M., Nakano, F., B. R. Hacker, P. E. van Keken, H. Kawabata, and R. J. Stern, 2010. Origin of cross-chain geochemical variation in Quaternary lavas from the northern Izu arc: Using a quantitative mass balance approach to identify mantle sources and mantle wedge processes. Geochemistry, Geophysics, Geosystems 11, Q10011, doi:10.1029/2010GC003050

Syracuse, E.M., Abers, G.A., 2006. Global compilation of variations in slab depth beneath arc volcanoes and implications. Geochem. Geophys. Geosyst. 7, Q05017, doi:10.1029/2005GC001045.

Syracuse, E. M., van Keken, P.E., and Abers, G.A., 2010. The global range of subduction zone thermal models, Physics of the Earth and Planetary Interiors 183, 73-90. doi:10.1016/j.pepi.2010.1002.1004

Reference information

Report on GeoPRISMS Mini-Workshop at Fall 2011 AGU – “Using Geoinformatics Resources to Explore the Generation of Convergent Margin Magmas”, Stern B, et al;

GeoPRISMS Newsletter, Issue No. 28, Spring 2012. Retrieved from http://geoprisms.nineplanetsllc.com
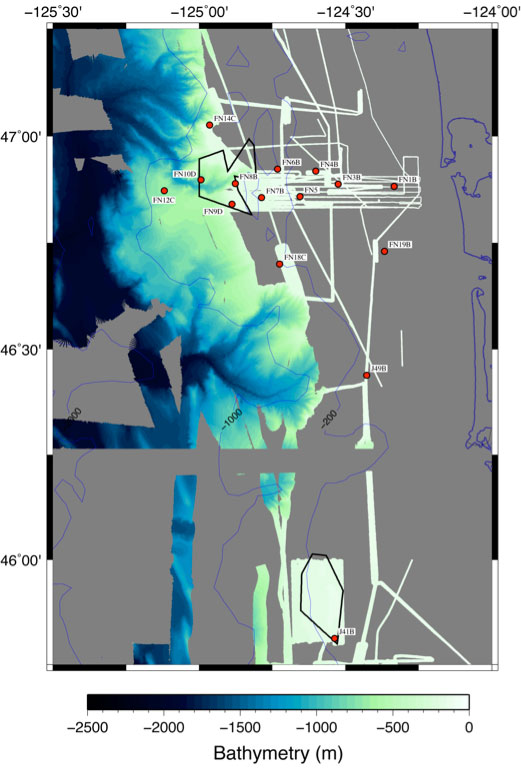
R/V Marcus Langseth Cruise to the Mariana Trench: February 2-29, 2012 Large Scale Active/Passive Source Seismic Experiment


John Lundquist (WHOI), Foreword by Doug Wiens (Washington University at St. Louis)

How much water is transported deep into the Earth at subduction zones, locked away as hydrous minerals in the downgoing oceanic mantle? This question is vital for understanding the source of water erupted at island arc volcanoes as well as determining whether significant water is carried deeper to the transition zone.

A pair of cruises sailed in early 2012 near the Mariana trench to help provide answers to these questions. The project, under the direction of Doug Wiens (Washington University in Saint Louis) and Dan Lizarralde (Woods Hole Oceanographic Institution), involved deploying 85 ocean bottom seismographs (OBS) from the R/V Thompson and seismic refraction and reflection imaging work carried out using the R/V Langseth airgun array.

The active source results will constrain the seismic velocity, and thus the degree of serpentinization, of the uppermost mantle thought to be occurring at faults associated with the bending of the Pacific plate near the trench. 25 OBSs remain deployed and will provide constraints on the maximum depth of serpentinization and catalog microearthquake activity on the bending faults. These OBSs will be recovered by the R/V Oceanus in January, 2013.

Seven graduate students participated in the two cruises. What is it like to go to sea on a seismic cruise for the first time? John Lundquist’s blog, from the Langseth cruise, provides some insight.

Figure 1. The two ships used for the Mariana seismic experiement:  (left) R/V Thomas G. Thompson, operated by the University of Washington; (above) R/V Marcus Langseth, operated by Columbia University.

Figure 1. The two ships used for the Mariana seismic experiement: (left) R/V Thomas G. Thompson, operated by the University of Washington; (above) R/V Marcus Langseth, operated by Columbia University.

Life at Sea: 8,653 miles, 4 airports, 3 inflight meals, and 34 hours later, I’m standing in the Hagåtña, Guam Airport. In my post trans world flight delirium “What the hell have I gotten myself into this time?” pops into my mind. I collect myself and step outside into the warm Pacific night air. A stark contrast from the artic chill I left in Maine. I arrive at the hotel…sweet, sweet sleep.

I wake up suddenly, unaware of where I am. A few hours of fitful rest hasn’t revived my senses or my mind. I look out the window and see surf breaking and the world starts to come back into focus. I’m John Lundquist….I know this….my next thought……go find someone in your group. I’m slightly anxious, as I’m about to rendezvous with a group of highly intellectual geophysicists, Ph.D. candidates, and graduate students. Having studied geology in college I should have felt prepared to meet these great minds. I walk down stairs and arrive at the breakfast buffet. As I scan the restaurant area, my gaze immediately rests on “the science” party….not too hard to pick out of a crowd. Nathan Miller, one of the chief scientists, walks up to me, “you must be John.” Apparently I wasn’t too hard to spot either. Introductions were made and the trip was underway.

We all piled into the rented mini-van for the Naval Base, where the ship was docked. We boarded the ship, were assigned our rooms, and then set free. We headed out for a few libations and our last taste of land before the 9AM departure time. The next day, as the ship cast off its lines, we all walked out to the Observation Deck. Pulling out of the harbor was beautiful. Guam’s mountainous landscape is breathtaking from the water. As we reach the end of the channel and transition into the open ocean, I quickly realized the ship is not stationary. Five minutes later…. seasickness…this is going to be a long month.

I begin my first shift as a watchstander by making my way down to the lab. I had briefly seen this area earlier, my first thought was “you could control the space shuttle from in here.” The lab is a complete floating technology hub, with about 40 computer monitors, countless processers, and Internet. From here everything science related is controlled and monitored. I was glad to finally get down there. As I sat down that first day, it was overwhelming to say the least. I had never been in a room with so many screens, let alone been put in charge of some of them. As a watchstander, we were basically assigned to monitor several scientific instruments. Every half hour, we entered data into a thirty-minute log. The function was to insure that all the instruments were still recording and running properly.

Figure 2. Protected Species Observers watching for marine wildlife.

Figure 2. Protected Species Observers watching for marine wildlife.

Day two, I walk down to my post in the lab only to find that nobody is there. Odd, I say to myself. I see on one of the remote cameras that everyone is outside working on the deck. I make my way aft and I’m instructed to put on a life jacket and “get to work.” The task at hand is to get the seismic streamer into the water. At this point, the streamer’s technicians, watchstanders, and ship’s crew were all working together. We were in charge of the streamer length number, the spacing of weights that need to be on the streamer, the spacing of acoustics, and position of birds. On this cruise (MGL1204) the streamer length was 8000 m. Along with the OBSs (ocean bottom seismometers), the streamer was used to record data in the active source survey. Hydrophones were strategically placed along the entire streamer. Because of the precise spacing of all the elements of the streamer, and the long length, it took about 12 hours to put it all in the water. It was great to be able to work with the ship’s crew and aid in the technical aspect of the mission. As a watchstander, they pretty much let you participate as much as you want to. I was carrying birds, putting them on the streamer, coupling streamer lengths, and adding weights, all while the sun was rising. It was fun, and exciting to be part of such a technical aspect of the project. Once the streamer was fully out, the gunners began the process of putting out the guns. Once the guns were in place, they began firing and we started collecting our active source data. After each “shot” from the air guns, the acoustic echo from the ocean floor was picked up by the hydrophones on the streamer and the OBS’s on the ocean floor. The data was then used to create bathymetric profiles of the sea floor around the trench.

Once the streamer and guns were in place, it was smooth sailing in terms of the instruments; the seas, on the other hand, were the contrary. The wind increased to 30 knots and the seas grew to 4-6 meters. Large seas, as you can imagine, change life aboard a ship. Everything is in constant motion. Sleeping was another story. Imagine sleeping in a moving bed…not conducive to quality rest. The way I solved that problem was by stuffing a bunch of blankets under one side of my mattress. This in effect created a v-notch that basically held me in one spot.

Life on a ship during a research mission is a lot of work. But nobody can work 24 hours a day. There was plenty to do on the ship during down time. After a few days, everyone began to fall into their own routine. There was a full theater, complete with big screen TV, PlayStation 3, and a hard drive filled with movies and TV shows. This was a good place to go and unwind after a long shift, or if the boat was pitching too much to sleep. At any given time, there was bound to be someone there to share a laugh with.

For exercise, the ship had a nice gym. A month is a long time to go without working up a sweat, the gym was a good place to get the heart rate up. There was a treadmill, elliptical, erg, and bike. The gym was also home to some dumbbells and homemade equipment, rendered by the engineers and ship’s crew over the years. A descent swell made working out quite interesting. With any pitch or roll of the ship, you could be sent flying. After a couple minutes of practice, though, you could get the hang of it.

Figure 3 (left). The main lab.  Figure 4 (middle). A line‐up of birds for the streamer. Watchstanders Matt Hughes and Martina Coccia assisting the ship’s crew. Figure 5 (right). Guns discharging.

Figure 3 (left). The main lab. Figure 4 (middle). A line‐up of birds for the streamer. Watchstanders Matt Hughes and Martina Coccia assisting the ship’s crew. Figure 5 (right). Guns discharging.

As for meals, the ship is equipped with a full galley and mess hall. Meals were served three times a day, but there was always food available. Dinnertime was especially good to relax and chat with other people on the ship. Sometimes, if it was nice, we would take our food up to the deck and eat outside under the Pacific sky. Sunset and sunrise were two of my favorite times on the ship. Its funny how on a ship, watching the sun go down or come up becomes another part of the routine. It was like a morning and afternoon break from the fast-paced research.

One of my favorite sky-watching spots was on the PSO bridge. Every seismic ship now has a crew of PSO’s or Protected Species Observers. These people spend their day watching the water. Their job is to make sure the seismic survey does not disturb or injure any marine life. They are on the lookout for whales, dolphins, seals, and other large marine mammals. If they see one too close to the ship, we stop firing the guns until the marine life has been deemed out of the danger zone.

In the end, I was happy to be part of such an interesting experiment. I arrived with no idea what to expect. By the end of the cruise, I was comfortable with technical equipment and data analysis in the lab. I got to meet several geophysicists and the whole ship’s crew. If you have any interest in how active source reflection seismology is carried out, get on a research cruise. You will learn about geophysics as well as about yourself. Thanks to the R/V Marcus Langseth MGL 1204 crew!

“Report from the Field” was designed to inform the community of real-time, exciting GeoPRISMS -related research. Through this report, the authors expose the excitement, trials, and opportunities to conduct fieldwork, as well as the challenges they may have experienced by deploying research activities in unique geological settings. If you would like to contribute to this series and share your experience on the field, please contact the GeoPRISMS Office at info@geoprisms.nineplanetsllc.com. This opportunity is open to anyone engaged in GeoPRISMS research, from senior researchers to undergraduate students.
We hope to hear from you!

Reference information
R/V Marcus Langseth Cruise to the Mariana Trench: February 2-29, 2012 Large Scale Active/Passive Source Seismic Experiment Lundquist J., Wiens D.;

GeoPRISMS Newsletter, Issue No. 29, Fall 2012. Retrieved from http://geoprisms.nineplanetsllc.com
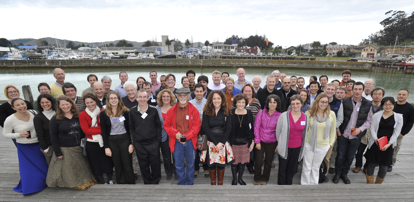
GeoPRISMS – EarthScope Science Workshop for Cascadia Report


Portland, Oregon, April 4-6 2012

Workshop Conveners: Geoff Abers1, Ramon Arrowsmith2, Joan Gomberg3, Andrew Goodliffe4, Adam Kent5, Katie Kelley6, Harvey Kelsey7, Julia Morgan8, Josh Roering9, Anne Trehu10, Kelin Wang11

1Lamont-Doherty Earth Observatory; 2Arizona State University; 3US Geological Survey; 4University of Alabama; 5Oregon State University; 6University of Rhode Island; 7Humboldt State University; 8Rice University; 9University of Oregon; 10Oregon State University; 11Pacific Geoscience Center

Figure 1. Bathymetry & topography of the Cascadia margin and associated tectonic elements.  Significant arc volcanoes indicated by orange triangles.  Map generated using GeoMapApp.

Figure 1. Bathymetry & topography of the Cascadia margin and associated tectonic elements. Significant arc volcanoes indicated by orange triangles. Map generated using GeoMapApp.

Background and Motivations

GeoPRISMS and EarthScope co-sponsored this science workshop on Cascadia, held April 4-6, 2012 at the World Trade Center in Portland, OR, as a joint effort to foster communication and collaboration among researchers with diverse interests in Cascadia. The broader goal was to inform and revise guiding documents for both communities. The following is a synopsis of the workshop, which is summarized more completely in a workshop report which can be found on-line at http://www.geoprisms.nineplanetsllc.com/past-meetings/207-cascadia-apr2012.html.

The Cascadia subduction zone, which cuts through three US states and western Canada (Figure 1), is the only region of the lower 48 states that is capable of producing a Mw 9 earthquake and has the greatest potential for volcanic eruptions in the conterminous US. A trove of new geological, geodynamic, and geophysical data has recently been collected and more will be forthcoming in the next several years, thanks in part to NSF investments in EarthScope and the onshore/offshore ARRA-funded Amphibious Array Facility (AAF) of the Cascadia Initiative (CI) [See GeoPRISMS Newsletter, Issue 27 for more information]. The Cascadia margin was also chosen as a Primary Site of the NSF GeoPRISMS program during the Subduction Cycles and Deformation (SCD) Initiative Implementation Workshop in 2011, and is thus recognized as a focal point of interest to a broad base of scientific communities. With so many other onshore and offshore research efforts in process or planning stages, the time was right to hold a science workshop to build synergies among communities, disciplines, and agencies with scientific interests in the area. Ongoing/future scientific efforts in Cascadia will benefit greatly from communication and coordination among these diverse groups.

The workshop took as its starting point the Cascadia SCD portion of the GeoPRISMS Science and Implementation Plans (http://www.geoprisms.nineplanetsllc.com/science-plan.html) and the EarthScope Science Plan. The primary goals of the workshop were to: (i) to clarify common research objectives within Cascadia; (ii) to address the range of interacting tectonic, magmatic, and surficial processes acting along the convergent margin; and (iii) to update implementation plans and timelines for GeoPRISMS and EarthScope research, considering available resources and infrastructure. A key additional goal of the workshop was to tap a broad cross-section of researchers working in Cascadia, or interested in future opportunities, and to foster interaction and discussions leading to new collaborations and understanding. This specifically included entraining early-career scientists (students, postdocs, and new faculty) interested in furthering Cascadia science.

Overview

The workshop was attended by nearly 180 participants (Figure 2), including ~60 graduate students and post-docs, for two days of talks and discussion in Portland, OR. The workshop aimed to provide a platform for review and synthesis of the current state of Cascadia science, involving a wide range of topics from tectonics to geophysics/geochemistry to sedimentation and beyond, and an open forum for discussion of the future directions of scientific research in Cascadia. A student symposium took place on the day before the workshop, introducing graduate students and post-docs to the Cascadia system through a series of talks and a regional field trip. The 2-day workshop was organized into a series of broad plenary talks to provide an overview of the Cascadia subduction system, interleaved with topical break-out sessions, short presentations on hot-topic science, poster sessions, and plenary discussions.

Figure 2.  Participants at the GeoPRISMS-EarthScope Cascadia Workshop in Portland, April 2012.

Figure 2. Participants at the GeoPRISMS-EarthScope Cascadia Workshop in Portland, April 2012.

The first day opened with plenary presentations on the tectonics, volcanism, faulting, and deep structure of the Cascadia subduction system, followed by updates on the current major projects ongoing in the Cascadia region. A set of evening discussion sessions (Special Interest Groups, or SIGs), focused on these major projects, providing opportunities for informal discussions of the details of each project, and helped define pathways for future research to link in to these efforts. The second day of the workshop opened with a plenary session on sedimentary processes in Cascadia, followed by two sets of special interest group (SIG) break-out discussions targeted at communities with interests in particular scientific questions or processes relevant to Cascadia. These discussions were followed by shorter plenary presentations on the geohazards specific to the Cascadia margin, and reports by each of the breakout groups summarizing the main discussion points in each session. The workshop wrapped up with a presentation from the student participants in the workshop, and an open plenary discussion outlining a “roadmap” to the future of Cascadia science.

For the GeoPRISMS community, one of the key objectives of the Cascadia workshop was to obtain input to refine the directions of GeoPRISMS research in Cascadia. In particular, the outcomes of the breakout and plenary discussions at the workshop will be incorporated into an updated version of the GeoPRISMS Implementation Plan (IP) for the Cascadia Primary Site (e.g., /science-plan.html). This document provides guidance to principal investigators interested in submitting proposals for funding under the NSF GeoPRISMS Program. Although proposals for research in Cascadia have been accepted under the GeoPRISMS solicitation since 2010, input from the community to clarify the research priorities for GeoPRISMS in Cascadia has been limited, with a strong emphasis on projects linked to the Cascadia Initiative.

Thus, a main goal of this workshop was to open an interdisciplinary dialog that would enable an integrated view of the Cascadia subduction zone, to solicit and incorporate feedback on science implementation in Cascadia from a broad-based community, and to provide focus and guidance for subsequent GeoPRISMS proposal solicitations.

For the EarthScope community, this workshop provided an integrative scientific dialogue building on the transformative observations from its augmented geodetic, magnetotelluric, and seismological facilities in Cascadia. Numerous science targets identified in the EarthScope Science Plan were illuminated in the presentations and discussions from the workshop. Initial research results from jointly NSF-funded EarthScope and GeoPRISMS projects were presented and momentum for additional joint proposals was evident and encouraged. In addition, IRIS and UNAVCO as the respective managers of the seismological and geodetic facilities of EarthScope are currently developing proposals for 2013-2018 operations and maintenance. The community discussions about science targets, priorities, and opportunities for coordination with other programs such as GeoPRISMS provide essential fodder for these necessarily integrative proposals.

Student Symposium

An important aspect of any scientific meeting is the engagement, preparation, and inspiration of the next generation of scientists and leaders. The student symposium, held before the workshop and attended by thirty-three students and two postdocs from thirteen universities, brought together representatives from this vital demographic, coordinated by Andrew Goodliffe (University of Alabama) with help from the GeoPRISMS Office and several workshop conveners and participants. Introductions to the GeoPRISMS and EarthScope Programs were followed by overviews of the geology and geophysics of the Cascadia region. The students and postdocs then took over the stage, giving one-slide descriptions of their research. Those presenting posters had an opportunity to highlight the work that they would be presenting later in the meeting.

In the afternoon, Ray Wells (USGS) and Ian Madin (Oregon Department of Geology and Mineral Industries) led a fieldtrip through the Portland metropolitan area. Participants got to see a spectacular Columbia River Basalt outcrop, evidence of mass wasting, a panorama of the Portland Basin and rocks form the Boring volcanic field flow. The field trip ended at the Zoo station of the Portland MAX light rail system where a spectacular core (recovered during the construction of the 3-mile-long tunnel) is displayed.

In the evening, following the icebreaker for the Cascadia workshop, symposium participants participated in a lively group dinner at Kell’s Irish Pub. Several workshop scientists joined the group and shared insights about their career path and the GeoPRISMS/EarthScope programs.

Workshop Program

The workshop was structured around several key topics:
  • Cascadia Crustal Evolution and Deformation
  • Earthquakes and Other Faulting Processes
  • Large-scale and Deep Processes
  • Sediment Transport, Accretion, and Subduction
Figure 3. Ray Wells demonstrates present-day Cascadia plate motions.

Figure 3. Ray Wells demonstrates present-day Cascadia plate motions.

Each topic was provided several keynote presentations, all of which can be found on the meeting website. These presentations led to stimulating plenary and break-out discussions.
The Cascadia Crustal Evolution and Deformation session highlighted the geological evolution of the Cascadia margin (Ray Wells, Figure 3), the pre-Quaternary magmatic history of Cascadia (Anita Grunder) and the history of recent magmatism and volcanism (Kathy Cashman).

On the topic of Earthquakes and Other Faulting Processes, a primary focus of both EarthScope and GeoPRISMS research at Cascadia, three different perspectives were offered, including new observations from the recent Tohoku earthquake and ongoing and planned work in Japan (Shuichi Kodaira), paleoseismic studies of past megathrust earthquakes along the Cascadia margin (Rob Witter), and recent seismicity and tremor activity along the Cascadia margin (Ken Creager).

The session on Large-scale and Deep Processes focused on the large-scale processes that control subduction system dynamics, with an emphasis on those processes that occur deep with the subduction system, such as the thermal-petrologic-fluid flow structure and dynamics of subduction zones (Ikuko Wada), the geodynamic framework of the Pacific Northwest, in light of new data obtained from seismic tomography and other sources (Gene Humphreys), and magma generation in Cascadia, in particular, reasons for the anomalously hydrous magmas in this hot system (Tom Sisson).

A session on Sediment Transport, Accretion, and Subduction addressed the Cascadia forearc as a setting for the transport of sediment from the Coast Ranges through the estuaries offshore to the accretionary prism and the abyssal plain, with topics ranging from the driving forces for erosion initiated through wedge dynamics (Mark Brandon), to deformation of sediment in the offshore accretionary wedge (Lisa McNeill) to the mechanisms and processes of delivery of sediment to the continental slope and abyssal plain by turbidites (David Piper).

Figure 4. Attendees participated in animated conversations during poster sessions.

Figure 4. Attendees participated in animated conversations during poster sessions.

Workshop attendees also participated in stimulating poster sessions addressing a wide range of Cascadia and related research topics (Figure 4). Poster-viewing time was provided during both days of the meeting schedule, and posters were well attended during these times, as well as at other times during the meeting.

Volunteers served as judges for the excellent posters that many of the students and postdocs presented. Although all of the presentations were of high quality, three posters rose to the top. These were: Allison Koleszar (postdoc, Oregon State University); Jason Patton (Ph.D. candidate, Oregon State University); and Wanda Vargas (M.S. student, Cornell University). Each student received a copy of the book “In Search of Ancient Oregon: A Geological and Natural History”, by Ellen Morris Bishop.

Special Interest Group (SIGs) discussions during the workshop to discuss scientific topics, targets, and research approaches relating to specific processes or approaches, for example, Deep Subduction Zone Structure, Megathrust Structure and Processes, Outer Forearc Structure and Segmentation, Geodetic Processes, Magmatism and Volcanic Processes, Volatile Processes and Cycles, and Sedimentary Processes. Each session was asked to address the following questions: (a) What are the key exciting scientific questions that can be addressed in Cascadia? (b) What infrastructure exists in Cascadia research to address them? (c) What knowledge gaps remain to be filled; what are future research directions? And (d) What challenges exist, and how can they be overcome? The follow-up break-out reports guided the closing discussions on the final day of the workshop.

In addition, several Implementation Interest Groups broke-out to review the status of ongoing projects, and to brainstorm about future efforts specific to Cascadia. Topics included Cascadia Initiative & Amphibious Arrays, Volcano Imaging, Geohazards, Energy & Mineral Potential, and Education & Outreach. Similar questions were posed to these break-out groups, including: (a) What infrastructure exists for Cascadia; what are associated opportunities? (b) What major research products and data streams will be available? (c) What gaps remain to be filled; what are the future directions for research? (d) What challenges exist, and how can they be overcome? Additional presentations addressed the important and diverse topic of Cascadia Geohazards, including those related to earthquakes, tsunamis and volcanoes. They also addressed the major new direction of earthquake early warning.

Throughout the workshop, students participated in plenary and breakout sessions, enthusiastically contributing to discussions. During lunches and in the evening, when most workshop participants had long since left the convention center, the symposium participants were still found hard at work. The students and postdocs ultimately developed a consensus statement emphasizing their take on the key aspects of the Cascadia system and the important scientific breakthroughs yet to come.

Roadmap to the Future – Science Implementation at Cascadia

Throughout the meeting, several key issues emerged from the presentation and discussions. A selection of these is listed below, and collectively they constitute a roadmap for refining the Cascadia science implementation plan. In most cases these issues cut across traditional discipline boundaries, and our understanding of them is impacted by multiple datasets.

The nature of segmentation along the subduction zone. Diverse data sets (geophysics, seismicity, volcano age and distribution, geochemistry, geodesy and paleogeodesy, etc.) reveal that the subduction zone is segmented along strike. Key uncertainties remain. Is the segmentation the same for different data sets? What are the ultimate controls of segmentation evident in different data? What is the influence of the incoming plate on segmentation? What is the influence of the inherited crustal structure and composition of the upper plate?

Earthquakes and the turbidite record. Inferences have been drawn from turbidite records that earthquakes rupture only part of plate boundary (M>~8 events) have regularly occurred in southern Cascadia with the northern portion rupturing only in entire-boundary, M9 earthquakes. These suggestions warrant further study as they have important impacts on hazard estimates and our basic understanding of the earthquake cycle along the plate boundary.

The hot and dry slab paradox. Uncertainty remains in reconciling the geochemical and petrological estimates of volatile fluxes in Cascadia with thermal models that predict a hot and dry subduction system. At present, measurements of pre-eruptive water contents seem relatively normal (compared to other arcs) in Cascadia basalts, however thermal models predict early dehydration and devolatilization. This remains an enigma for Cascadia. The relationship between timing of dehydration, extent of dehydration and the role of volatile fluxes in magmatism remains unclear.

Distribution of volcanism. What are the ultimate controls on the distribution of volcanism in Cascadia? Specifically, what parameters influence the formation of large central volcanoes that occur along the arc versus the more dispersed monogenetic volcanism that characterizes the regions between the larger volcanoes? Can this distribution be linked to the slab, structures in the mantle wedge, or in the upper plate? How do the relatively localized back-arc volcanic complexes (Simcoe, Newberry, Medicine Lake) relate to the arc system? What are the roles of mantle fluxes, solid/fluid flow vectors, and crustal magma processing?

Role of surrounding regions. Cascadia did not develop in isolation, and important questions remain regarding the evolution of Cascadia in relation to surrounding geologic provinces? These include the Yakima fold and thrust belt, the Basin and Range, The High Lava Plains, Klamath/Sierra block, the Yellowstone hot spot trail and the Juan de Fuca ridge. How have the interactions between these geologic provinces changes through time to influence the formation and evolution of the North American continent?

Imaging the physical properties deep within the crust and upper mantle. Different models of subduction processes, including the transition from stick-slip to stable sliding along the megathrust and the migration of magma through the crust, are difficult to image geophysically. How can traditional techniques for imaging subsurface seismic velocity and electrical conductivity be improved to better image these processes? How can better images be integrated with other geophysical and geochemical observations?

Sediment transport. The transport of sediment from the subaerial forearc to offshore is a response to tectonic processes. Also, the sediment records of such transport provide insight to the past tectonic events. Specific questions relate to the role of subduction zone earthquakes in initiating landslides, in mobilizing sediment sources and in modulating estuaries as sediment storage compartment or conduits for offshore sediment delivery. Can records from lakes, especially landslide-dammed lakes, be archives of erosion history in the Coast Ranges? How effective are carbon and other biomarkers in tracing sediment through watersheds to the offshore and can these methods, along the sediment transport data, be applied to determine sediment mass balances for Coast Range watersheds located at different latitudes along the Cascadia margin?

These topics, arising from discussions at the Cascadia workshop, informed the implementation plan developed for the Cascadia margin, specifically to guide proposals submitted to the GeoPRISMS Program, but of broad interest to the research community. The full workshop report for the Cascadia Science Workshop and the final GeoPRISMS Implementation Plan can be accessed and downloaded from the meeting website: http://www.geoprisms.nineplanetsllc.com/past-meetings/207-cascadia-apr2012.html

 Reference information
GeoPRISMS – EarthScope Science Workshop for Cascadia Report, Abers, G., Arrowsmith, R., Gomberg, J., Goodliffe, A., Kent, A., Kelley, K., Kelsey, H., Morgan, J., Roering, J., Trehu, A. and Wang, K.;
GeoPRISMS Newsletter, Issue No. 29, Fall 2012. Retrieved from http://geoprisms.nineplanetsllc.com
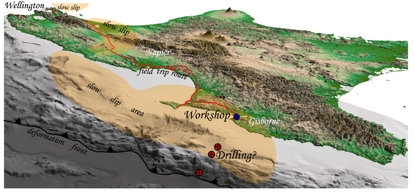
COAST: Cascadia Open-Access Seismic Transects


Steve Holbrook1, Graham Kent2, Katie Keranen3, Paul Johnson4, Anne Trehu5, Harold Tobin6, Jackie Caplan-Auerbach7, Jeff Beeson5

1University of Wyoming; 2University of Nevada; 3University of Oklahoma; 4University of Washington; 5Oregon State University; 6University of Wisconsin; 7Western Washington University

The Cascadia margin, where the Juan de Fuca and Gorda plates subduct beneath North America, poses substantial (but poorly understood) earthquake and tsunami hazards to the Pacific Northwest. Several major scientific infrastructure and research initiatives are focusing effort on the Cascadia margin. These include GeoPRISMS, EarthScope, encompassing the Plate Boundary Observatory (PBO), the Cascadia Initiative of ocean-bottom seismometers (OBS) with extensive onshore seismometers and geodetic stations associated with the Amphibious Array Facility, the Ocean Observatories Initiative (OOI) and NEPTUNE/CANADA cable observatories, and the SeaJade OBS program off Vancouver Island. GeoPRISMS has selected Cascadia as a focus site, and the first deployment of the Cascadia Initiative OBSs included a concentration of instruments off Grays Harbor, Washington (see GeoPRISMS Newsletter Issue 27, 2011). Here we report on a recently completed, open-participation/open-access geophysical survey of the Cascadia margin off central Washington, which provides new opportunities to participate in Cascadia studies.

Figure 1. (A) Map of COAST track lines (labeled 1-11), plotted on multibeam bathymetric grid acquired during MGL1212. (B) Inset map showing location of COAST survey on Cascadia continental margin. Bathymetry contoured at 500 m intervals. (C) Example of post-stack time migration across deformation front on Line 4 (yellow line, Fig. 1A).

Figure 1. (A) Map of COAST track lines (labeled 1-11), plotted on multibeam bathymetric grid acquired during MGL1212. (B) Inset map showing location of COAST survey on Cascadia continental margin. Bathymetry contoured at 500 m intervals. (C) Example of post-stack time migration across deformation front on Line 4 (yellow line, Fig. 1A).

The COAST (Cascadia Open-Access Seismic Transects) survey comprised a successful, two-week cruise of the R/V Langseth in July 2012 that acquired diverse geophysical data, including multichannel seismic reflection, multibeam bathymetry, gravity, and magnetic data in a high-priority corridor of the Cascadia margin off Grays Harbor. The scientific goals of this project include (1) constraining the position of the plate boundary, which is poorly known in this region; (2) imaging downdip variations in the character of the subduction thrust across the transition from aseismic creep to seismogenic rupture; (3) quantifying pore fluid pressure, fluid budgets, and upstream inputs to the zone of episodic tremor and slip; and (4) determining the geological controls on methane distribution in the forearc. Substantial shipboard processing efforts produced seismic sections processed through post-stack migration, as well as bathymetric data that provide nearly complete coverage of the forearc region (Fig. 1). Shipboard processing of the data provides the following initial observations:

(1) The Pleistocene accretionary wedge is well imaged and shows landward-vergent thrust faulting throughout our survey area. An outboard series of ramp-and-thrust structures gives way to a region characterized by folds that separate “oases” of undeformed sediment. (2) The oceanic basement reflection is strong and clear outboard of the deformation front but becomes much weaker beneath the Pleistocene wedge. At this stage of processing it is not clear whether this reflects inaccurate processing, loss of energy by scattering off a complex surface, or (more intriguingly) a physical change in the plate boundary structure. (3) Where it is imaged beneath the margin, the top of oceanic crust appears gently dipping beneath the Pleistocene wedge, then bends into a steeper inclination beneath the Miocene wedge. (4) A widespread methane hydrate system, indicated by bottom-simulating reflections, exists in the outer wedge and upper slope of the study area. Increased amplitudes of the Bottom Simulating Reflection (BSR) in tilted sediments suggest that fluid flow along bedding planes controls methane flux.

The COAST program was the first Langseth cruise conducted as an open-participation/open-access cruise. Participants were selected by an open application process, through which seventeen members of the science party were selected from over 60 applicants. Of the twenty members of the visiting science party, eight had not previously been aboard a research vessel, and an additional five (13 total) had never participated in a marine seismic reflection survey. A robust daily shipboard education program included science lectures, scheduled tutoring on seismic processing, and informal data interpretation.

All cruise data are open-access and available immediately. Raw geophysical and seismic data can be downloaded from the LDEO website. Seismic sections processed shipboard through post-stack time migration can be downloaded from the UTIG seismic data base. The cruise report can be downloaded here. We encourage all interested parties to make use of the COAST data in any way desired, including writing proposals to process and analyze the data, integrating the data with other recent and ongoing Cascadia initiatives, and incorporating the data and images in the classroom.

 Reference information
COAST:  Cascadia Open-Access Seismic Transects, Holbrook, S., Kent, G., Keranen, K., Johnson, P., Trehu, A., Tobin, H., Caplan-Auerbach, J., Beeson, J.
GeoPRISMS Newsletter, Issue No. 29, Fall 2012. Retrieved from http://geoprisms.nineplanetsllc.com